EUR/USD

Higher Timeframes
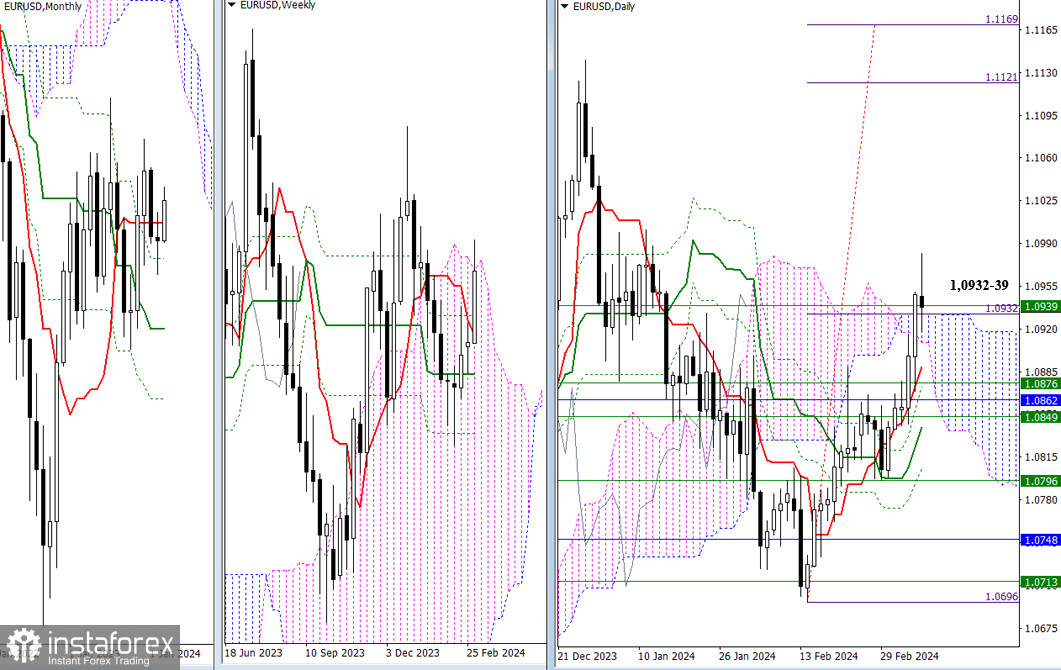
The past week helped bullish players break out of the restraining zone of resistance at 1.0849 – 1.0862 – 1.0876 (weekly levels + monthly short-term trend). The market tested the upper boundaries of the Ichimoku clouds on daily (1.0932) and weekly (1.0939) timeframes. A bullish breakthrough relative to the clouds and a reliable consolidation will allow for consideration of new plans, with the nearest upward targets being the high at 1.1140 and the daily target at 1.1121 – 1.1169. If the euro fails to break beyond the Ichimoku cloud, the market will return to the attraction and influence zone at 1.0849–62–76, which will now serve as support.

H4 – H1
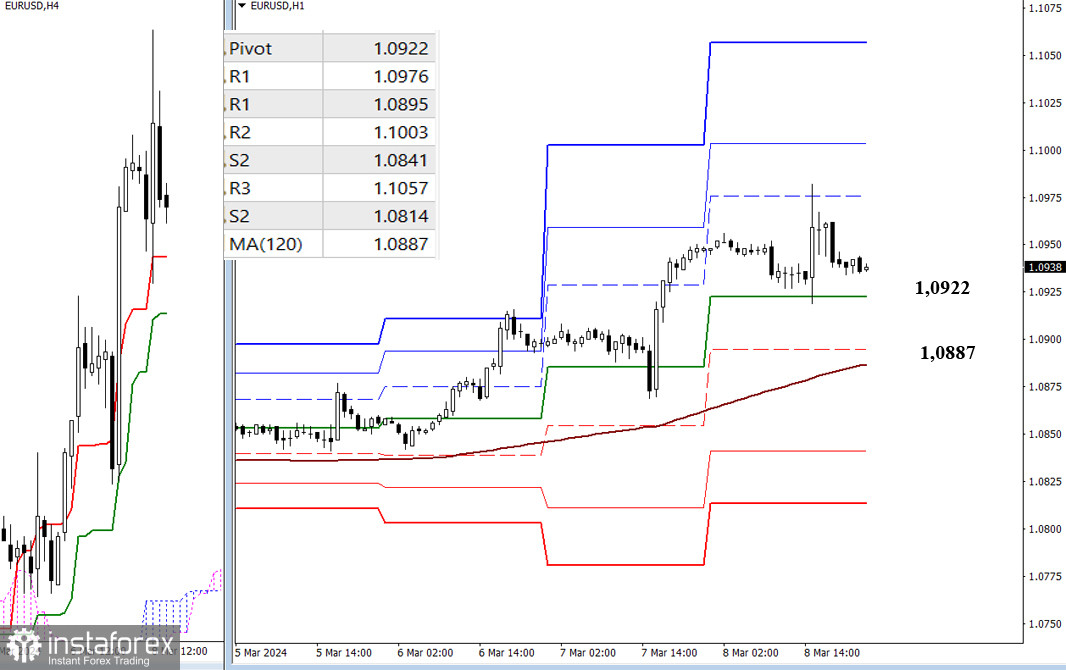
The pair is above key levels on lower timeframes, so the main advantage currently belongs to the bulls. Developing the upward movement within the day can be achieved by working with classic pivot points' resistance levels. If a corrective decline develops, a breakthrough of key levels, currently at 1.0922 – 1.0887 (central pivot point of the day + weekly long-term trend), may change the current balance of power. Shifting priorities will redirect the market's attention to the support levels of classic pivot points.
***
GBP/USD

Higher Timeframes
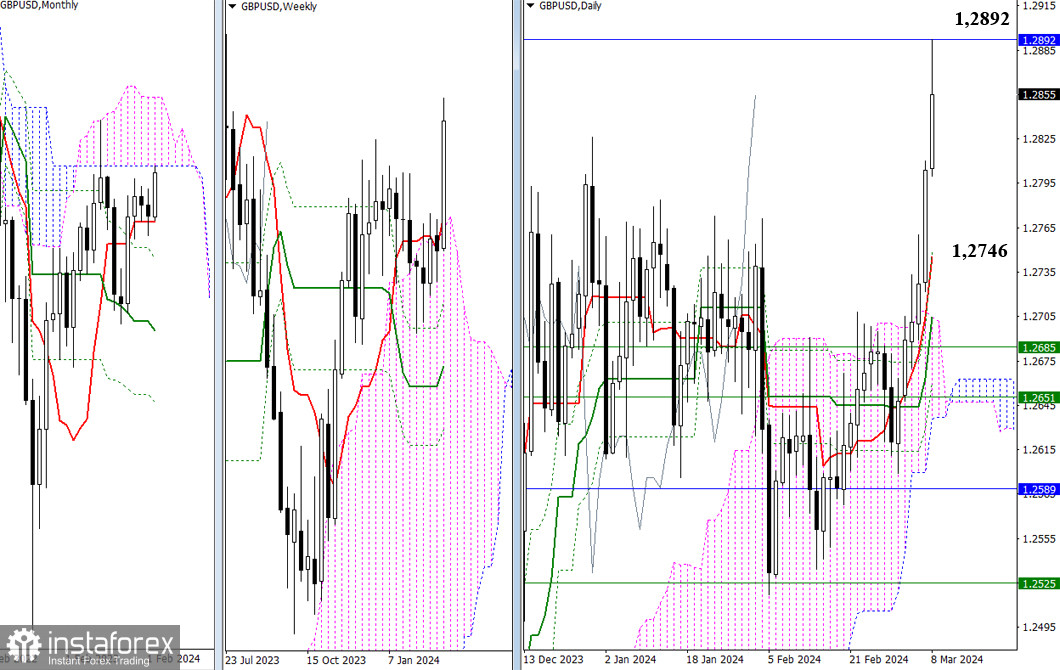
Bulls showed significant effectiveness last week by breaking through restraining levels and a prolonged consolidation zone. They managed to reach the next upward target – the lower boundary of the monthly cloud (1.2892). As a result, the main focus of bullish players is now on breaking through this boundary and consolidating in the monthly bullish cloud, with the prospect of rising to its upper boundary. Failure, a rebound from 1.2892, and the loss of the achieved level will bring bears back into the market, aiming to first fulfill the corrective decline to the support of the daily Ichimoku cross, with its nearest supports now at 1.2746 – 1.2704, and then correct to the weekly short-term trend (1.2685).

H4 – H1
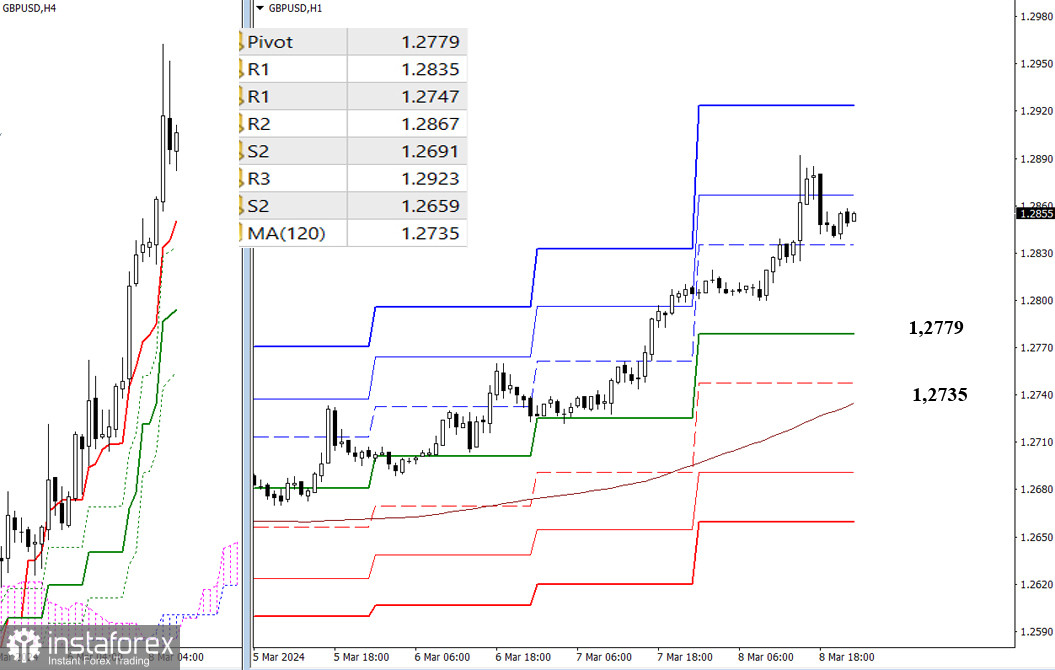
On lower timeframes, the main advantage belongs to the bulls. Continuing the rise within the day will be directed towards working with the resistance of classic pivot points, the new placement of which is better observed at market opening. Previous market activity and the effectiveness of bullish players have led to the formation of a deep zone in case a corrective decline develops. Key reference points for bearish players now are the central pivot point (1.2779) and the weekly long-term trend (1.2735). A breakthrough of key levels can change the current balance of power, with a likely simultaneous rebound from the encountered and tested boundary of the monthly cloud on higher timeframes.
***
The technical analysis of the situation uses:
Higher timeframes - Ichimoku Kinko Hyo (9.26.52) + Fibonacci Kijun levels
Lower timeframes - H1 - Pivot Points (classic) + Moving Average 120 (weekly long-term trend)
 English
 Русский
 Bahasa Indonesia
 Bahasa Malay
 ไทย
ไทย Español
 Deutsch
 Български
 Français
 Tiếng Việt
 中文
中文 বাংলা
বাংলা हिन्दी
 Čeština
 Українська
 Română

