Long positions on USD/JPY:
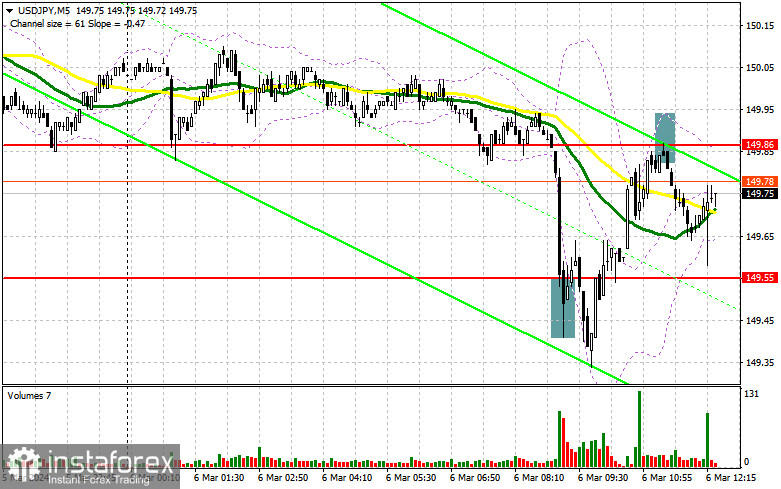
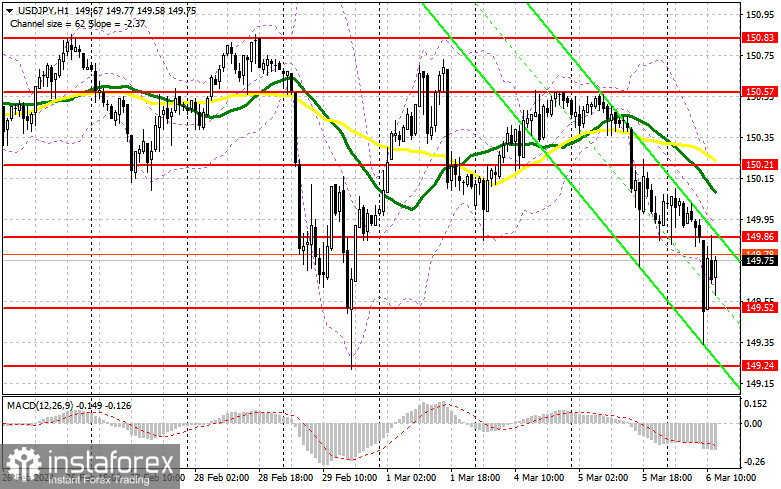
The US dollar has a good chance of further recovery, but this requires strong US economic data. Data on changes in employment from ADP are expected, where a significant increase could remind traders that the fight against inflation is not over yet. This would further strengthen the greenback. Meanwhile, markets expect a speech by Federal Reserve Chairman Jerome Powell. His hawkish remarks to the US Congress will also strengthen the pair. Nonetheless, I plan to act according to the morning scenario around the support level of 149.52. Forming a false breakout there, similar to what I analyzed earlier, will provide a suitable entry point for buying with the target in the resistance area of 149.86. Breaking and consolidating above this range will allow bulls to strengthen their positions, opening up the chance for long positions aiming for 150.21, where the moving averages are located. The next target would be the peak at 150.57, where I plan to take profits. If the pair declines and there is no activity from buyers at 149.52 in the second half of the day, combined with dovish rhetoric from the Federal Reserve officials, pressure on the US dollar will likely increase. In such a case, I will attempt to enter the market near 149.24 after a false breakout. I also plan to open long positions on a rebound only from 148.95, allowing a 30-35 point intraday correction.
Short positions on USD/JPY:
Bears remain in the market, performing well near 149.86. This level will be the focus in the second half of the day. A false breakout there after the ADP labor market data release will provide a good entry point for short positions with a move back to the support at 149.52. A breakthrough and a reverse test from below will deal a more serious blow to the bulls' positions, triggering stop-loss orders and opening the way to 149.24, which will be a significant success for bears. The next target is located in the area of 148.95, where I plan to take profits. If the pair rises and bears show no activity at 149.86 in the second half of the day, and Powell takes a hawkish stance on interest rates, dollar buyers will regain positions. Therefore, it would be better to delay selling until the pair reaches the next resistance at 150.21. If there is no downward movement there, I will sell the pair on a rebound from 150.57, allowing a 30-35 point intraday correction.
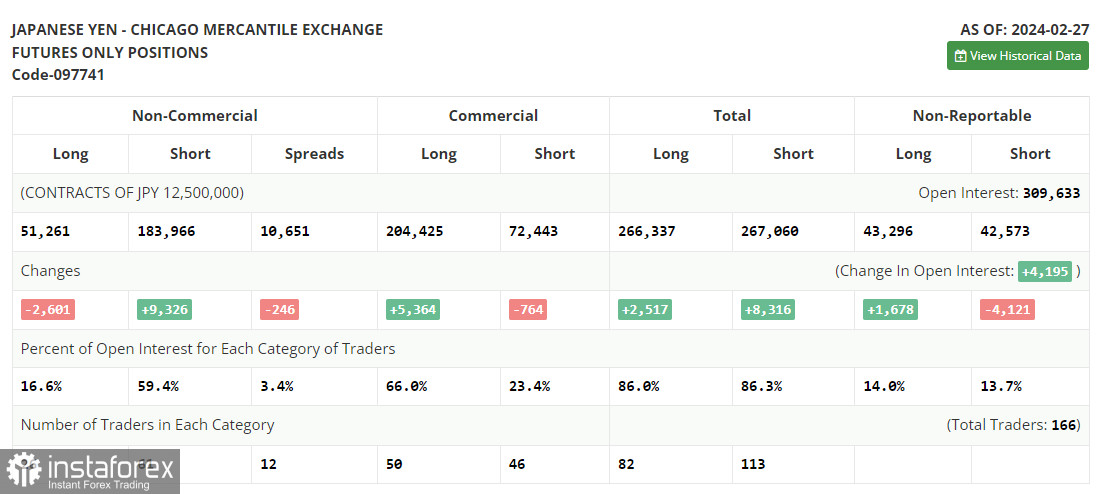
In the COT report for February 27, there was an increase in short positions and a reduction in long positions. The US dollar at 150 yen remains a problem for traders. Primarily because it is expensive, and around this level, the Bank of Japan usually starts to intervene in the forex market. However, there are no reasons to sell yet. Recent statements by central bank officials about normalizing policy led to sharp yen purchases and a quick recovery, anticipating the continuation of the Federal Reserve's aggressive monetary policy. The latest COT report shows that non-commercial long positions decreased by 2,601 to 51,261, while non-commercial short positions jumped by 9,326 to 183,966. Consequently, the spread between long and short positions narrowed by 246.
Indicator signals:
Moving averages:
The pair is trading below the 30 and 50-day moving averages, indicating a downtrend.
Note: The author considers the period and prices of moving averages on the hourly chart H1 and differs from the general definition of classic daily moving averages on the daily chart D1.
Bollinger Bands:
In case of a decline, the lower band of the indicator around 149.65 will act as support.
Indicator descriptions:
- Moving average defines the current trend by smoothing out volatility and noise. Period 50. Marked in yellow on the chart.
- Moving average defines the current trend by smoothing out volatility and noise. Period 30. Marked in green on the chart.
- MACD (Moving Average Convergence/Divergence). Fast EMA 12. Slow EMA 26, SMA 9.
- Bollinger Bands. Period 20.
- Non-commercial traders are speculators such as individual traders, hedge funds, and large institutions using the futures market for speculative purposes and meeting certain requirements.
- Long non-commercial positions represent the total long open positions of non-commercial traders.
- Short non-commercial positions represent the total short open positions of non-commercial traders.
- Total non-commercial net position is the difference between the short and long positions of non-commercial traders.
 English
 Русский
 Bahasa Indonesia
 Bahasa Malay
 ไทย
ไทย Español
 Deutsch
 Български
 Français
 Tiếng Việt
 中文
中文 বাংলা
বাংলা हिन्दी
 Čeština
 Українська
 Română


