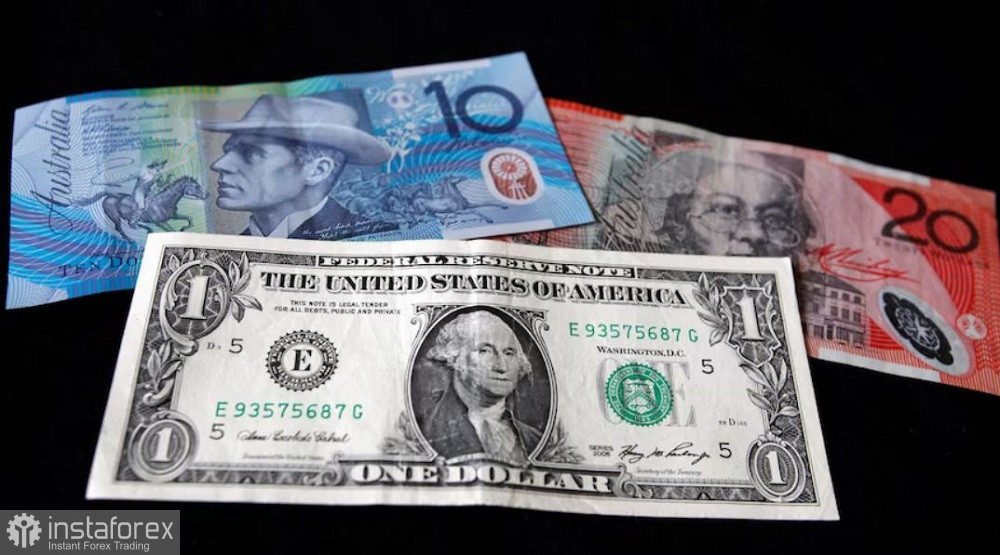
The Australian dollar is trading sideways against the US dollar despite the general weakening of the greenback at the start of the new trading week. The US Dollar Index is showing downward dynamics on the back of increased interest in risk. The Australian dollar was under pressure because of minor macroeconomic reports that were published during Monday's Asian session.

This included the Melbourne Institute's monthly inflation gauge. In fact, this report examines how consumers are affected by inflation when they buy goods and services. The indicator had been in positive territory for the three preceding months but unexpectedly fell into negative territory in February (-0.1%), with the forecast for a rise to 0.4% month-on-month. On an annualized basis, it also declined to 4.0%. The downward trend has been recorded for the second month in a row. This indicator serves as an early warning ahead of the publication of official inflation data.
The labor market report also disappointed buyers of AUD/USD. The ANZ job ads index came out in the red zone, reflecting negative trends. This index is calculated by specialists from the Australia and New Zealand Banking Group. The February index decreased by 2.6%, while analysts had expected a decline of 0.6%. The index is a leading indicator of official statistics in the labor market, so it puts pressure on the Australian currency.
One more indicator was in the "red zone. The volume of issued building permits in January decreased by 1.0%, while most experts anticipated positive dynamics, namely an increase of 3.8%. For the second month in a row, the indicator has been seen in the negative area.
On the one hand, the macroeconomic reports published today are of secondary importance. However, they complemented the overall fundamental picture, which is not in favor of the Australian dollar. Let me remind you that according to the results of the fourth quarter of 2023, the consumer price index increased by 4.1% YoY, with a forecast of 4.3%. The index has been showing downward dynamics for the fourth consecutive quarter. On a quarterly basis, the index also came out in the red zone, being at 0.6%, the smallest reading since the first quarter of 2021. Australia's unemployment rate hit a two-year high in January, rising to 4.1% (the highest level since January 2022). The number of employed people grew by only 0.5 thousand, while analysts had predicted growth of 26 thousand.
On Wednesday, March 6, one more report will be published. This time, it is a key report. We will learn about the growth in the Australian economy in the 4th quarter. According to preliminary estimates, GDP increased by 0.3% in quarterly terms. In the third quarter, the economy expanded by 0.2%. Year-over-year, the indicator should rise by 1.5% after a 2.1% rise in the third quarter. The announced result is the weakest since the first quarter of 2021. As we can see, the forecasts themselves are quite pessimistic. Thus, if the report is in the "red zone," the Australian dollar will be under the strongest pressure, as the "dovish" expectations regarding further actions by the RBA will strengthen again.
There is no consensus in the market as to when exactly the Reserve Bank will decide to cut the interest rate. Curiously, the regulator does not rule out another increase this year. Still, most experts point to the second half of this year. In particular, economists polled by Bloomberg said that the Australian regulator will start to lower the key rate in the third quarter of this year. It is worth noting that according to the results of the previous survey, most of the respondents pointed to the 4th quarter. If the Australian economy demonstrates weaker-than-expected growth, the Reserve Bank may soften its rhetoric at its next meeting on March 19. At least, the RBA minutes will hardly reflect the regulator's readiness to tighten monetary policy even more. This will be quite enough to strengthen dovish expectations and increase pressure on the Australian dollar.
At the moment, the pair is trading sideways. Summing up, we may say that the situation is uncertain. On the daily chart, the pair is on the middle line of the Bollinger Bands indicator, on the Kijun-sen line, but it is under the Tenkan-sen line and the Kumo cloud. It is advisable to consider selling only after the price settles below 0.6500, i.e., under the middle line of the Bollinger Bands indicator and under all lines of the Ichimoku indicator. The nearest target of the downward movement is 0.6450 (lower Bollinger Bands line on the same timeframe). The main target is 0.6340 (lower Bollinger Bands line), but this target will be available to bears in case of a considerable rise in the greenback. The pair has not been trading in this area since November 2023.
 English
 Русский
 Bahasa Indonesia
 Bahasa Malay
 ไทย
ไทย Español
 Deutsch
 Български
 Français
 Tiếng Việt
 中文
中文 বাংলা
বাংলা हिन्दी
 Čeština
 Українська
 Română

