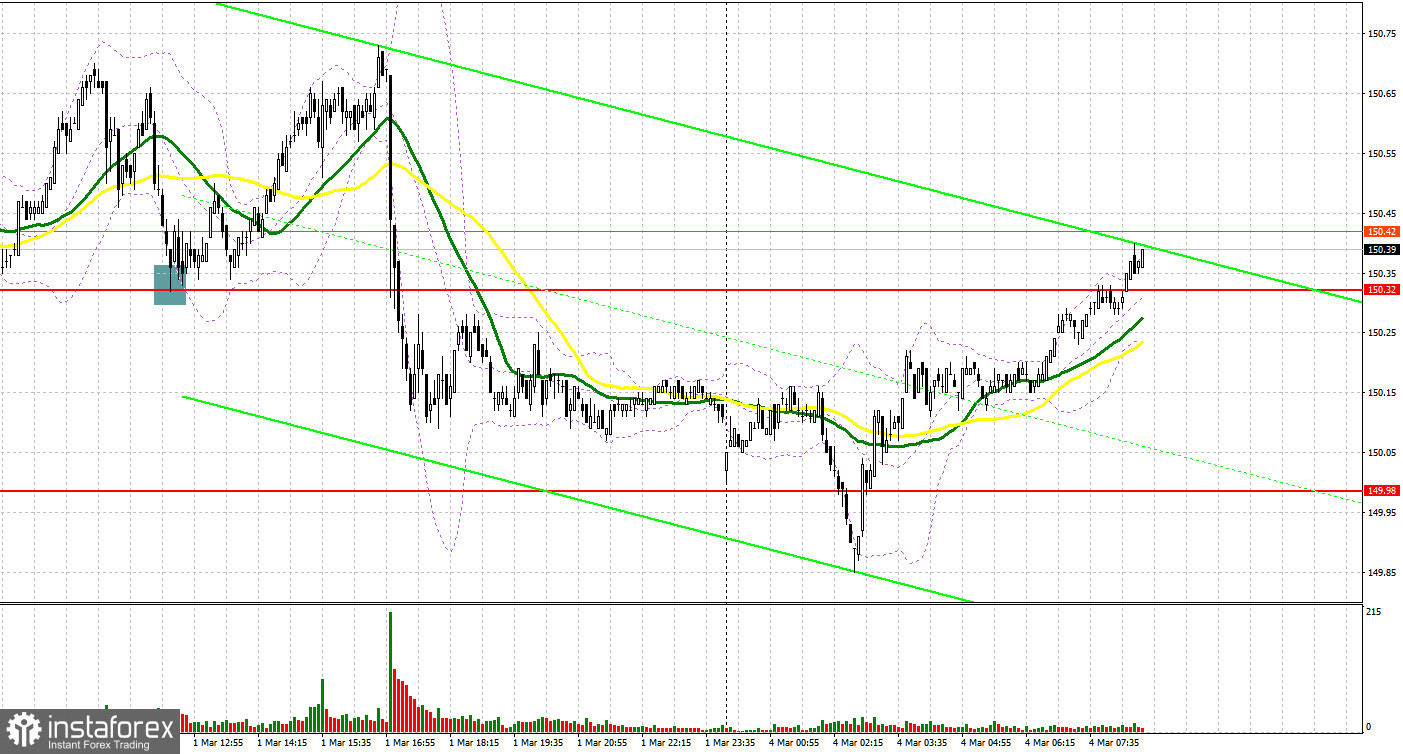
Last Friday, several signals were generated. Let's look at the 5-minute chart and figure out what happened. In early trade, I recommended focusing on the level of 150.32 when making trading decisions. A decline followed by a false breakout at 150.32 created a strong buy signal, resulting in a 40-pip rise in the pair. In late trade, a false breakout at 150.32 generated another signal for entering long positions, with the pair moving up by another 40 pips.

Long positions on USD/JPY:
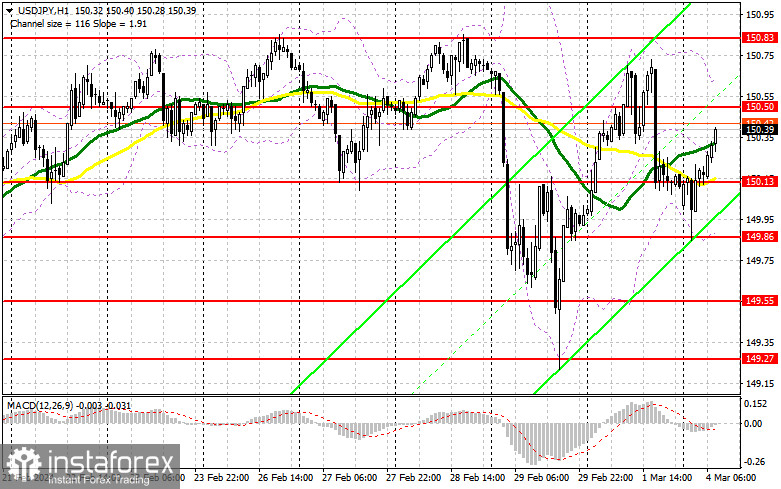
Weak US data prevented the price from reaching the one-year high, which led to a major dollar sell-off at the end of the week. However, today's upbeat statistics on capital spending in Japan and downbeat data on monetary base revived demand for the greenback. That is why I recommend buying the pair in case of a decline to the nearest support level of 150.13. A false breakout at this mark will make it possible to add long positions in anticipation of a new rise to 150.50. If the price breaks above this level and tests it from the top down, the volume of long positions will increase further, with the USD/JPY pair climbing to the one-year high of 150.83. The most distant target will be 151.21, where I plan to lock in profits. In a bear case scenario, if bulls fail to regain control of 150.13, which is quite possible, especially after the statements of Japanese politicians last week, the dollar will come back under pressure and slide to the 149.86 area. Only a false breakout at this mark will create a buy signal. Traders are recommended to buy USD/JPY on a rebound at around the low of 149.55 to catch an intraday correction of 30-35 pips.
Short positions on USD/JPY:
Bears will most likely take the lead at around 150.50 in case of a continued rise in the pair. A false breakout at this level will make it possible to open short positions in anticipation of a decline to the intermediate support level of 150.13. If the price breaks below this mark and tests it from to bottom up, the way to 149.86 will open. The most distant target will be the area of 149.55, where I plan to lock in profits. In a bull case scenario, the lack of selling activity at 150.50 will help buyers regain control of the market. However, it is too early to talk about an upward trend. In this case, it is better to postpone short positions until the price tests the next resistance level of 150.83. At this mark, I recommend going short on a rebound at 151.21, counting on an intraday correction of 30-35 pips.


Indicator signals:
Moving Averages
The quotes are trading just above the 30-day and 50-day moving averages, indicating a continued rally in the US dollar.
Note: The period and prices of moving averages are considered by the author on the 1-hour chart and differ from the general definition of the classic daily moving averages on the daily chart.
Bollinger Bands
In case of a decline, the lower boundary of the indicator at around 149.86 will act as support.
Description of indicators
- The 50-day moving average determines the current trend by smoothing volatility and noise. It is marked in yellow on the chart.
- The 30-day moving average determines the current trend by smoothing volatility and noise. It is marked in green on the chart.
- The MACD indicator (Moving Average Convergence/Divergence - convergence/divergence of moving averages). Fast EMA period 12. Slow EMA period 26. SMA period 9
- Bollinger Bands. Period 20
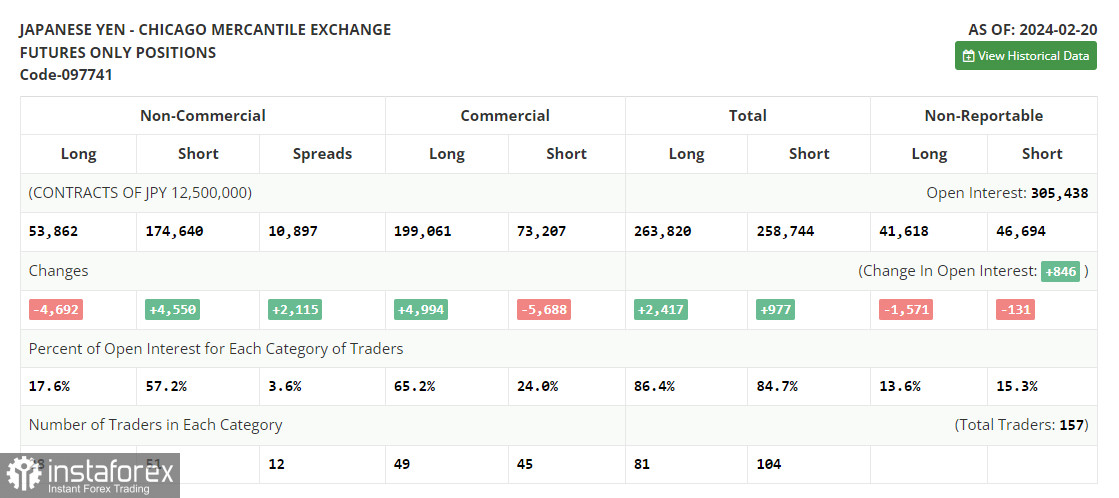
- Non-commercial traders are speculators such as individual traders, hedge funds, and large institutions that use the futures market for speculative purposes and meet certain requirements.
- Long non-commercial positions represent the total long open position of non-commercial traders.
- Short non-commercial positions represent the total short open position of non-commercial traders.
- The total non-commercial net position is the difference between short and long positions of non-commercial traders.
 English
 Русский
 Bahasa Indonesia
 Bahasa Malay
 ไทย
ไทย Español
 Deutsch
 Български
 Français
 Tiếng Việt
 中文
中文 বাংলা
বাংলা हिन्दी
 Čeština
 Українська
 Română

