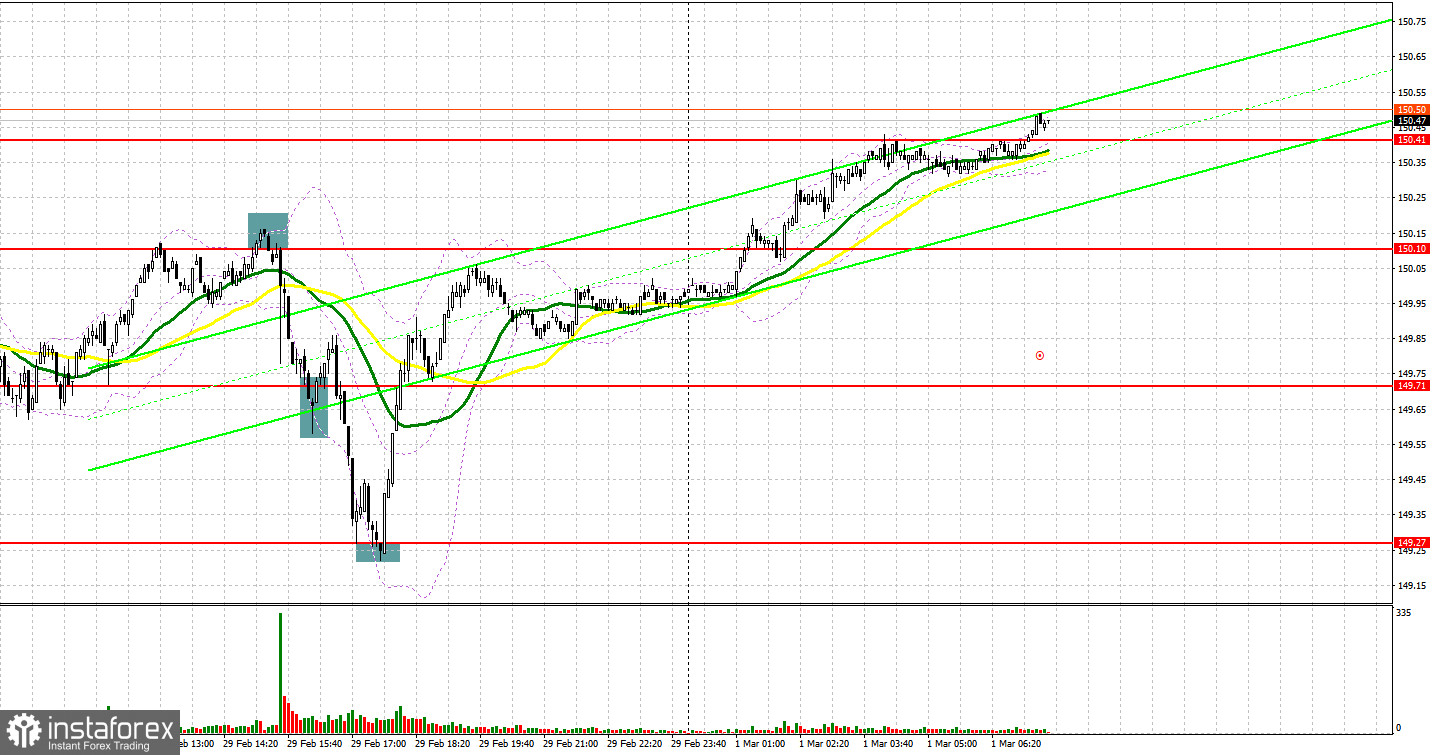
Yesterday several signals to enter the market were generated. Let's take a look at the 5-minute chart and figure out what happened there. In my previous forecast, I paid attention to the level of 149.71 and planned to make decisions on entering the market from there. The decline and a false breakout at the level of 149.71 led to an excellent buy signal, which resulted in the pair growing by 40 pips. In the afternoon, selling on a false breakout from 150.10 led to the pair falling to 149.71. The bulls' attempt to protect this level did not bring the expected result, but long positions after a false breakout in the area of 149.27 came in very handy, which allowed the bulls to grab about another 80 pips from the market.

What is needed to open long positions on USD/JPY
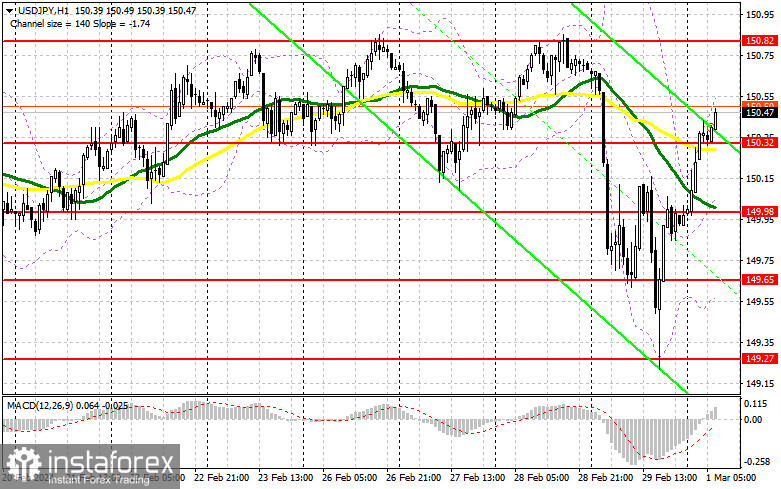
Yesterday's strong data, namely, the US PCE price index, became the main reason for buying the US dollar that pushed the yen down. Today, figures on the unemployment rate and Japan's manufacturing PMI have already been released. The data fully matched the consensus and did not help the yen regain any position. Clearly, the dollar is aiming to update its one-year highs, where it will inevitably encounter active actions by sellers. In case the instrument declines in the first half of the day, I will act around the nearest support at 150.32, formed today. But hopes for this level are slim. Only the formation of a false breakout there will create suitable conditions for opening long positions in anticipation of a new surge to 150.82. A breakout and a reverse test from above downwards of this area will suggest another good option for buying the US dollar. As a result, USD/JPY may climb to the area of 151.21. The highest target will be the area of 151.55, where I plan to take profits. In the scenario of USD/JPY's decline and lack of activity at 150.32, which is more realistic, the US dollar will again come under selling pressure. This will lead to a slight nudge of the price down to 149.98. But only a false breakout there will suggest opening long positions. I plan to buy USD/JPY immediately on a dip only from a low around 149.65, bearing in mind a correction of 30-35 pips within the day.
What is needed to open short positions on USD/JPY
In case USD/JPY extends its yesterday's uptrend, the bears will likely make their presence known only around the one-year high of 150.82, which I intend to rely on. A false breakout there will be a suitable condition for opening short positions, aiming for a decrease to the intermediate support of 150.32, where, just below, the moving averages favoring the buyers are located. A breakout and a reverse test from below upwards of this range will deal a more serious blow to the bulls' positions, triggering buyers' stop losses and opening a path to 149.98, which will definitely impact the pair's upward potential, increasing the chances for a decrease in the US dollar. The lowest target will be 149.65, where I plan to take profits. In the scenario of a rise in USD/JPY and a lack of selling activity at 150.82, the buyers will completely take the market under their control. In such a case, it's best to postpone short positions until the test of the next resistance at 151.21. In the absence of downward movement there, I will sell USD/JPY immediately on a rebound from 151.55, reckoning a correction of USD/JPY down by 30-35 pips within the day.

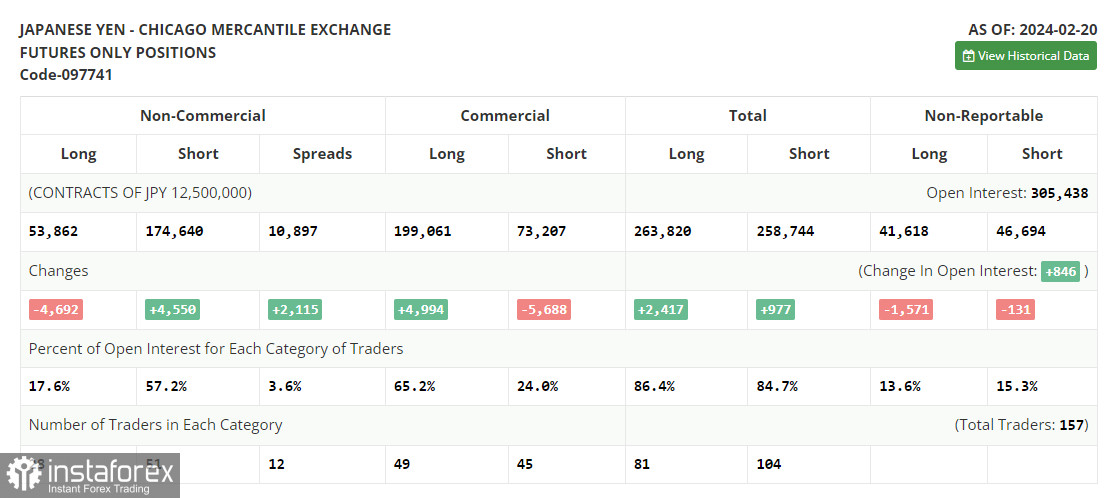
In the COT report (Commitment of Traders) for February 20th, there was an increase in short positions and a decrease in long ones. Many traders find themselves baffled as 150 yen per dollar is expensive, and it's clear that the Bank of Japan starts to intervene there, but there are absolutely no reasons for selling yet. Hence, trading continues within a sideways channel, which is proven by the dynamics of positions in the futures market. The latest COT report indicates that non-commercial long positions decreased by 4,692 to 53,862, while non-commercial short positions jumped by 4,550 to 174,640. As a result, the spread between long and short positions widened by 2,115.

Indicators' signals
Moving averages
The instrument is trading slightly above the 30 and 50-day moving averages. It indicates a probable growth in USD.
Note: The period and prices of the moving averages are considered by the analyst on the 1-hour chart and differ from the general definition of classic daily moving averages on the daily chart.
Bollinger Bands
In case USD/JPY goes down, the indicator's lower border at about 149.60 will act as support.
Description of indicators
- Moving average (moving average, determines the current trend by smoothing out volatility and noise). Period 50. It is marked yellow on the chart.
- Moving average (moving average, determines the current trend by smoothing out volatility and noise). Period 30. It is marked green on the chart.
- MACD indicator (Moving Average Convergence/Divergence — convergence/divergence of moving averages) Quick EMA period 12. Slow EMA period to 26. SMA period 9
- Bollinger Bands (Bollinger Bands). Period 20
- Non-commercial speculative traders, such as individual traders, hedge funds, and large institutions that use the futures market for speculative purposes and meet certain requirements.
- Long non-commercial positions represent the total long open position of non-commercial traders.
- Short non-commercial positions represent the total short open position of non-commercial traders.
- Total non-commercial net position is the difference between short and long positions of non-commercial traders.
 English
 Русский
 Bahasa Indonesia
 Bahasa Malay
 ไทย
ไทย Español
 Deutsch
 Български
 Français
 Tiếng Việt
 中文
中文 বাংলা
বাংলা हिन्दी
 Čeština
 Українська
 Română

