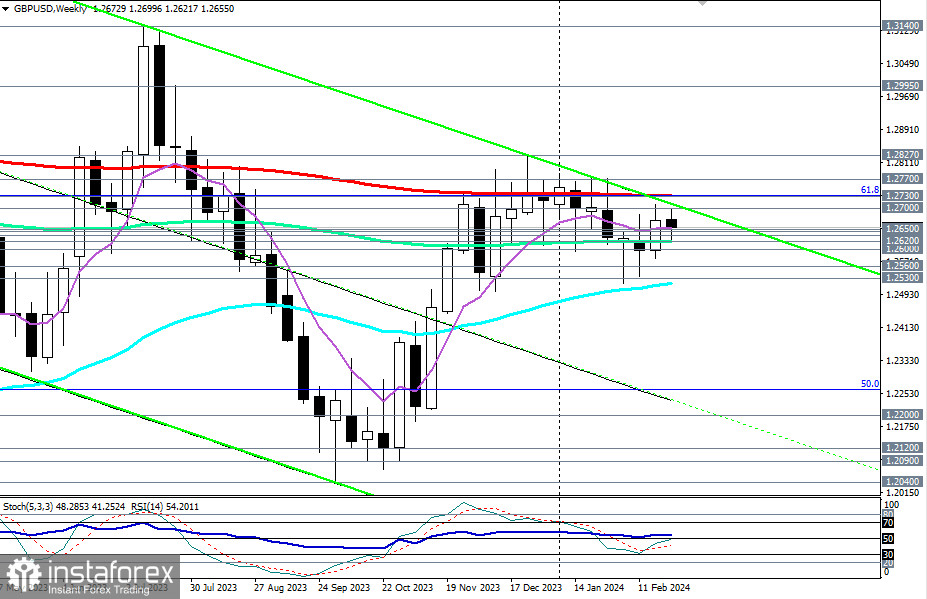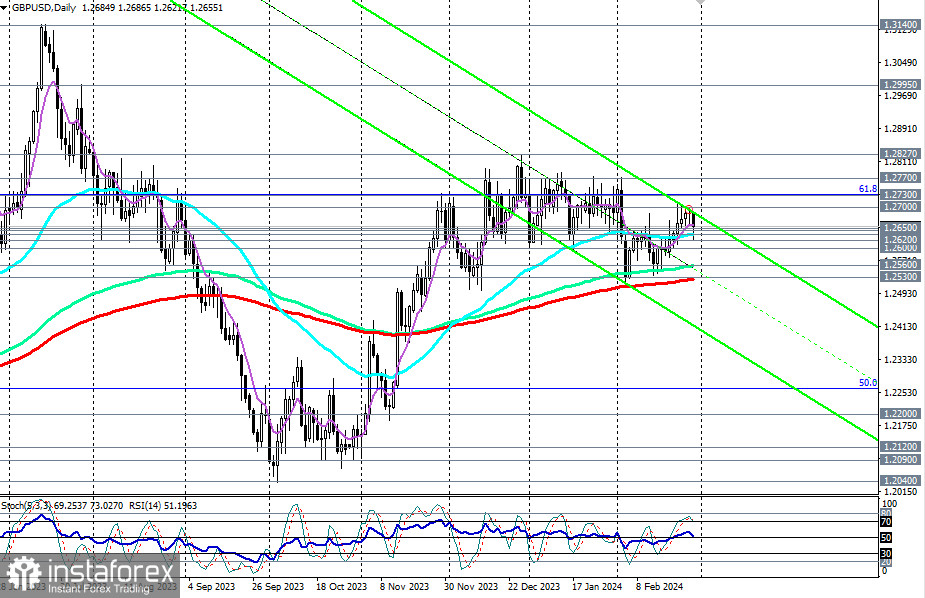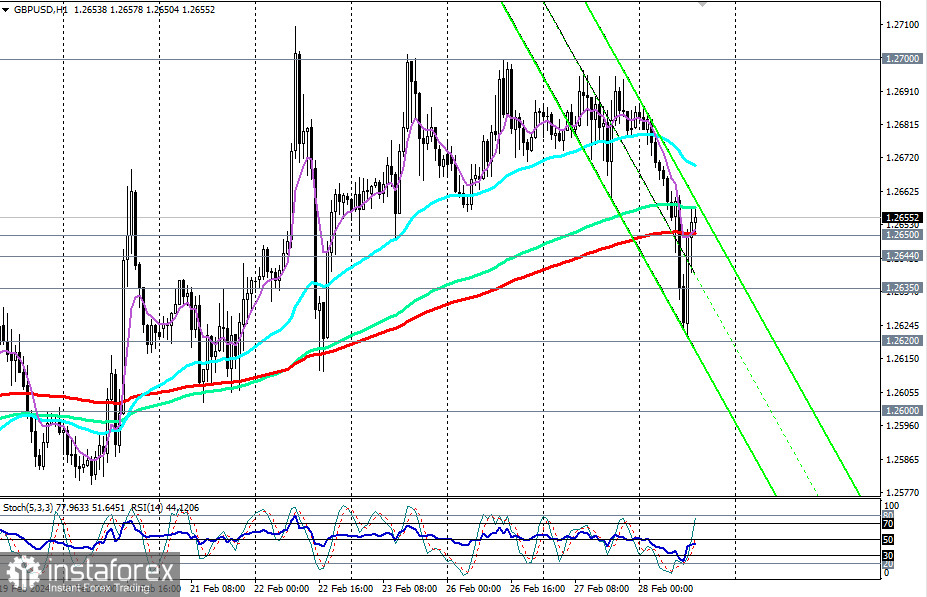
The GBP/USD pair started the trading day with a decline, breaking through the crucial short-term support levels at 1.2650 (200 EMA on the 1-hour chart) and 1.2644 (200 EMA on the 4-hour chart), then tested the significant long-term support level at 1.2620 (144 EMA on the weekly chart).
As of writing, GBP/USD is attempting a correction and a return to the zone of the short-term bullish market, attempting to break the resistance level at 1.2650.

However, for the 14th consecutive week, GBP/USD has remained within the range between the key resistance level of 1.2730 (200 EMA on the weekly chart) and the key support level of 1.2530 (200 EMA on the daily chart).
The pair still lacks drivers for a more confident movement in either direction. It is possible that until March 21, GBP/USD will continue to trade within this range between these key levels.
A breakthrough of the support level at 1.2620 may signal the implementation of a bearish scenario. A breakthrough of the key support level at 1.2530, in turn, will lead GBP/USD into the zone of the medium-term bearish market. In the case of further decline, GBP/USD will head into the depths of the downward channel on the weekly chart, the lower boundary of which passes near local support levels at 1.1700, 1.1800.

In an alternative scenario, a breakthrough of the resistance level at 1.2655 (144 EMA on the 1-hour chart) may trigger further growth. However, for now, it will likely be limited by the resistance level at 1.2730.
Only a breakthrough of the zone of key resistance levels 1.2730 (200 EMA on the weekly chart), 1.2770 (50 EMA on the monthly chart) will bring GBP/USD into the zone of the long-term bullish market, making long-term long positions preferable.
Support levels: 1.2650, 1.2644, 1.2635, 1.2620, 1.2600, 1.2560, 1.2530, 1.2500
Resistance levels: 1.2655, 1.2700, 1.2730, 1.2770, 1.2800, 1.2827, 1.2900, 1.2995, 1.3100, 1.3140, 1.3200
Trading Scenarios
Main Scenario: Sell Stop 1.2615. Stop-Loss 1.2660. Targets 1.2600, 1.2550, 1.2515, 1.2500, 1.2400, 1.2300, 1.2200, 1.2000, 1.1800
Alternative Scenario: Buy Stop 1.2660. Stop-Loss 1.2615. Targets 1.2700, 1.2730, 1.2770, 1.2800, 1.2827, 1.2900, 1.2995, 1.3100, 1.3140, 1.3200
"Targets" correspond to support/resistance levels. This also does not mean that they will necessarily be reached but can serve as a guide when planning and placing your trading positions.
 English
 Русский
 Bahasa Indonesia
 Bahasa Malay
 ไทย
ไทย Español
 Deutsch
 Български
 Français
 Tiếng Việt
 中文
中文 বাংলা
বাংলা हिन्दी
 Čeština
 Українська
 Română

