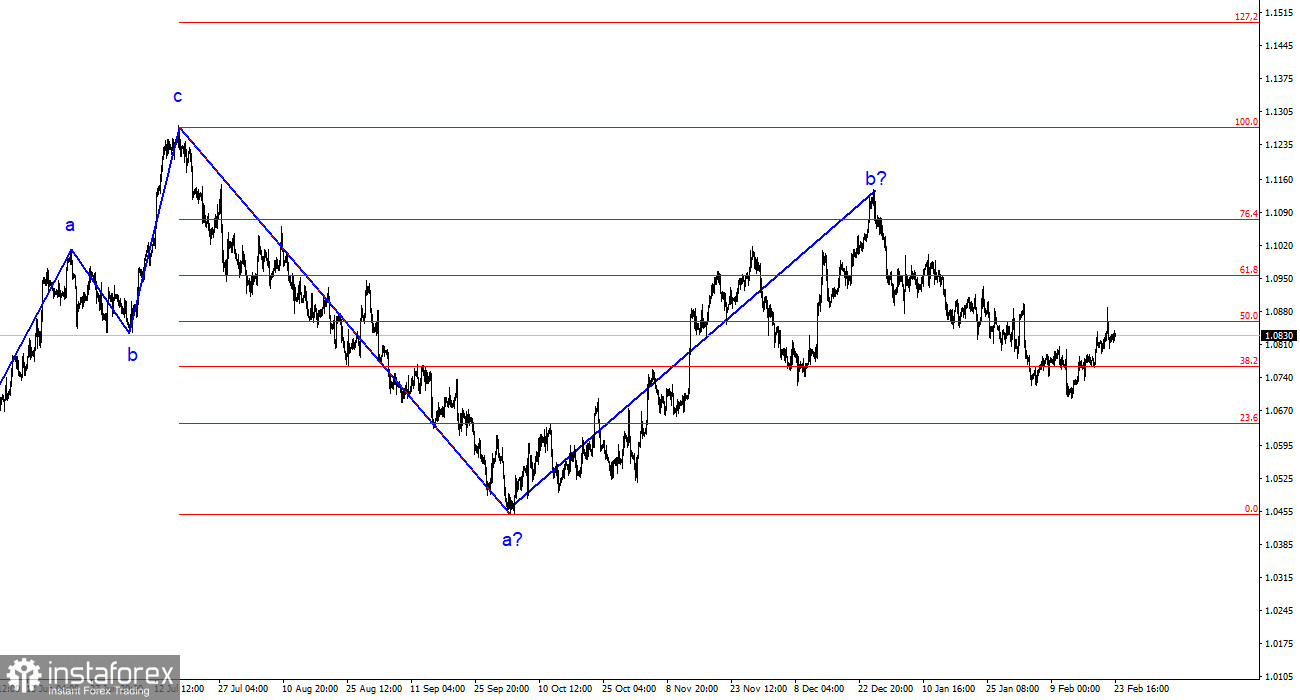
The wave analysis of the 4-hour chart for the EUR/USD pair remains unchanged. Over the past year, we have seen only three-wave structures that constantly alternate with each other. Currently, the construction of another three-wave structure continues – a downward one, which started on July 18 of last year. The presumed wave 1 is completed, and wave 2 or b has complicated three or four times, but is currently also completed, as the pair's decline has been ongoing for over a month.
The upward segment of the trend may still resume, but its internal structure will be unreadable in this case. I remind you that I try to identify unambiguous wave structures that do not tolerate dual interpretation. If the current wave analysis is correct, the market has moved on to the formation of wave 3 or c. A successful attempt to break through the 1.0788 level, corresponding to 76.4% Fibonacci, once again confirmed the market's readiness for sales. The next target is now the 1.0637 level, which is equivalent to 100.0% Fibonacci. However, I do not expect the decline of the euro to end there. Wave 3 or c should be much more extensive both in time and in targets.
The decline of the euro may resume shortly.
The EUR/USD pair did not change on Friday, and the range of movements was very weak. There was virtually no news background during the day, although some analysts highlighted reports from IFO and GDP in Germany. However, in my opinion, these data had no chance of affecting the market's mood. The final value of GDP in the fourth quarter was -0.3%, as in preliminary estimates. There were no surprises; the German economy officially entered a recession, and there was nothing for the market to "respond" to. IFO indices, despite their respect, are secondary indicators that rarely interest market participants.
Based on all of the above, there was not much to expect from Friday initially. I believe that now the unsuccessful attempt to break through the 1.0880 level, corresponding to 61.8% Fibonacci, is much more important. Since the construction of the presumed wave 3 or c continues, which should take a very elongated form, it is not excluded that this week we saw the construction of internal wave 2. If this is indeed the case, the unsuccessful attempt to break 1.0880 may indicate the completion of this wave. If this assumption is correct, the pair may resume its decline within wave 3 in 3 or c next week. I believe that no news background can now interfere with the construction of this wave.
General Conclusions:
Based on the analysis of EUR/USD, I conclude that the construction of a bearish wave set continues. Wave 2 or b has taken a completed form, so in the near future, I expect the continuation of the construction of an impulsive descending wave 3 or c with a significant decline in the pair. Currently, another internal corrective wave is being built, which may end soon. I continue to consider only sales with targets around the calculated level of 1.0462, which corresponds to 127.2% Fibonacci.
On the larger wave scale, it can be seen that the presumed wave 2 or b, which in length is already more than 61.8% Fibonacci from the first wave, may be completed. If this is indeed the case, the scenario with the construction of wave 3 or c and the decline of the pair below the 4-figure mark has begun to unfold.
 English
 Русский
 Bahasa Indonesia
 Bahasa Malay
 ไทย
ไทย Español
 Deutsch
 Български
 Français
 Tiếng Việt
 中文
中文 বাংলা
বাংলা हिन्दी
 Čeština
 Українська
 Română


