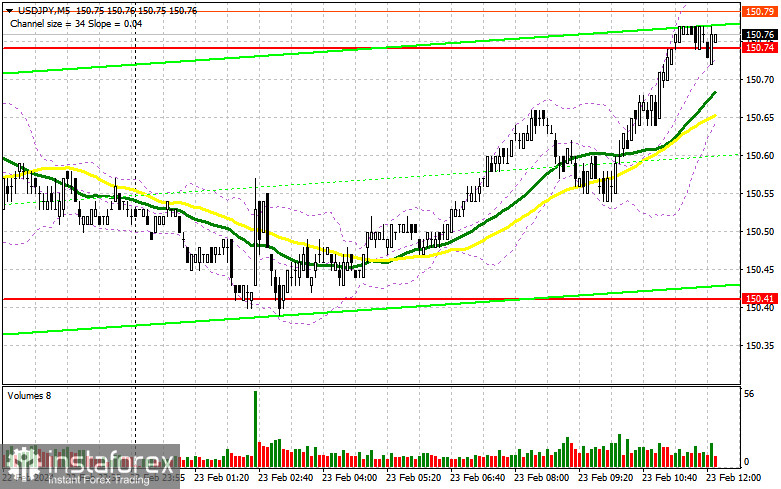
In my previous article, I paid attention to the level of 150.74 and planned to make decisions on entering the market from there. Let's look at the 5-minute chart and figure out what happened there. USD/JPY actually went up, but by the time of writing, the price had not reached the point where a false breakout had formed. I will focus on these levels in the afternoon, since the technical picture has not been revised.

What is needed to open long positions on USD/JPY
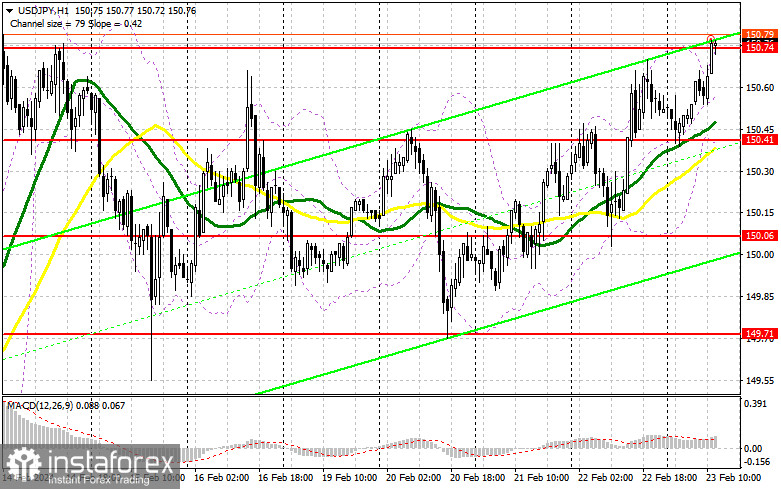
There is no significant US data in the economic calendar ahead, so it will be quite problematic for dollar buyers to break above 150.74. Buying at the current highs is not the best idea at the end of the week, so I prefer to trade during corrections. A decline and formation of a false breakout near the closest support at 150.41, established yesterday, will be a proper condition for increasing long positions in anticipation of another surge to 150.74. A breakout and a retest from above to below this range will create a good buying opportunity for the dollar, capable of pushing USD/JPY upwards, towards a new weekly high of 151.08. The highest target will be the 151.55 area, where I plan to take profits. In a scenario of the pair's decline and lack of buying activity at 150.41, the US dollar will gain come under pressure at the end of the week. Still, USD/JPY will remain within the sideways channel. In such a case, I will try to enter the market around 150.41, at the midpoint of the sideways channel. But only a false breakout there will signal to open long positions. I plan to buy USD/JPY immediately on a dip only from a low of around 150.06, bearing in mind a correction of 30-35 pips within the day.
What is needed to open short positions on USD/JPY
In case USD/JPY rises, the bears need to assert their strength at around the resistance of 150.74, as missing this level would mean saying goodbye to the chances of a downward correction. Only a false breakout there will be a suitable condition for short positions inside the overall bullish trend, aiming for a decrease to the area of 150.41, where the moving averages are located. A breakout and a reverse test from below upwards of this range will deal a more serious blow to the bulls' positions, leading to the activation of stop orders and opening a path to 150.06. The lowest target will be the area of 149.71, where I plan to take profits. In the scenario of USD/JPY's rise and the absence of activity at 150.74, as is currently the case, the buyers will strengthen their initiative, encouraging the upward trend. In such a case, it's best to postpone sales until the test of the next resistance at 151.08. If the downward movement does not develop there, I will sell USD/JPY immediately on a rebound from 151.55, but only aiming for a correction down by 30-35 pips within the day.
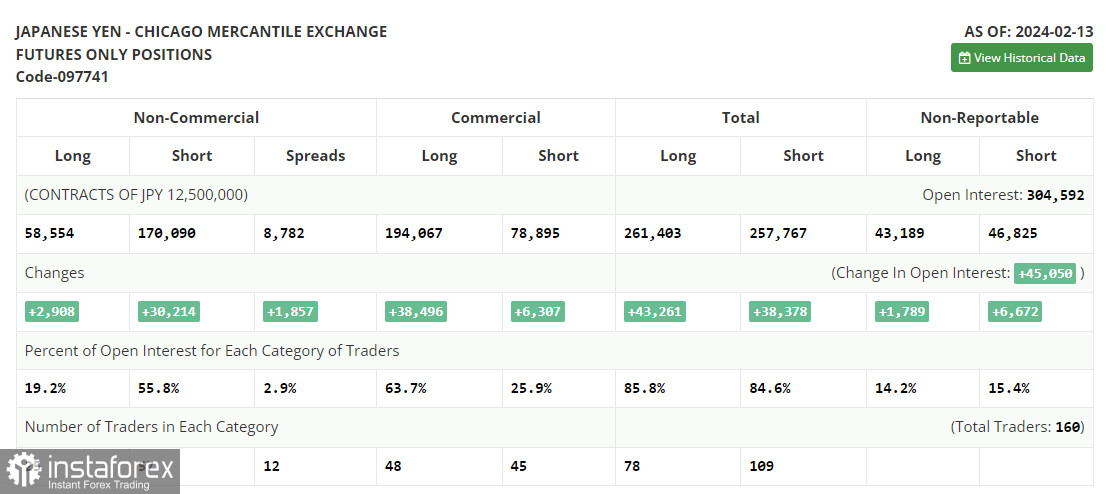
In the COT report (Commitment of Traders) for February 13th, there was an increase in both short and long positions. Considering that traders are increasingly betting on the Federal Reserve maintaining a hawkish stance, as well as leaning towards a soft policy by the Bank of Japan, it's not surprising to see an increase in short positions against the yen. The trend of the dollar strengthening and the yen weakening continues. Hence, my trading decisions rest entirely on such fundamentals. The latest COT report indicates that non-commercial long positions increased by 2,908 to 58,554, whereas non-commercial short positions jumped by 30,214 to a level of 170,090. Consequently, the spread between long and short positions increased by 1,857.

Indicators' signals
Moving averages
The instrument is trading above the 30 and 50-day moving averages. It indicates a further rise in the US dollar.
Note: The period and prices of the moving averages are considered by the analyst on the 1-hour chart and differ from the general definition of classic daily moving averages on the daily chart.
Bollinger Bands
In case USD/JPY goes down, the indicator's lower border at about 150.41 will act as support.
Description of indicators
- Moving average (moving average, determines the current trend by smoothing out volatility and noise). Period 50. It is marked yellow on the chart.
- Moving average (moving average, determines the current trend by smoothing out volatility and noise). Period 30. It is marked green on the chart.
- MACD indicator (Moving Average Convergence/Divergence — convergence/divergence of moving averages) Quick EMA period 12. Slow EMA period to 26. SMA period 9
- Bollinger Bands (Bollinger Bands). Period 20
- Non-commercial speculative traders, such as individual traders, hedge funds, and large institutions that use the futures market for speculative purposes and meet certain requirements.
- Long non-commercial positions represent the total long open position of non-commercial traders.
- Short non-commercial positions represent the total short open position of non-commercial traders.
- Total non-commercial net position is the difference between short and long positions of non-commercial traders.
 English
 Русский
 Bahasa Indonesia
 Bahasa Malay
 ไทย
ไทย Español
 Deutsch
 Български
 Français
 Tiếng Việt
 中文
中文 বাংলা
বাংলা हिन्दी
 Čeština
 Українська
 Română

