EUR/USD

Higher Timeframes
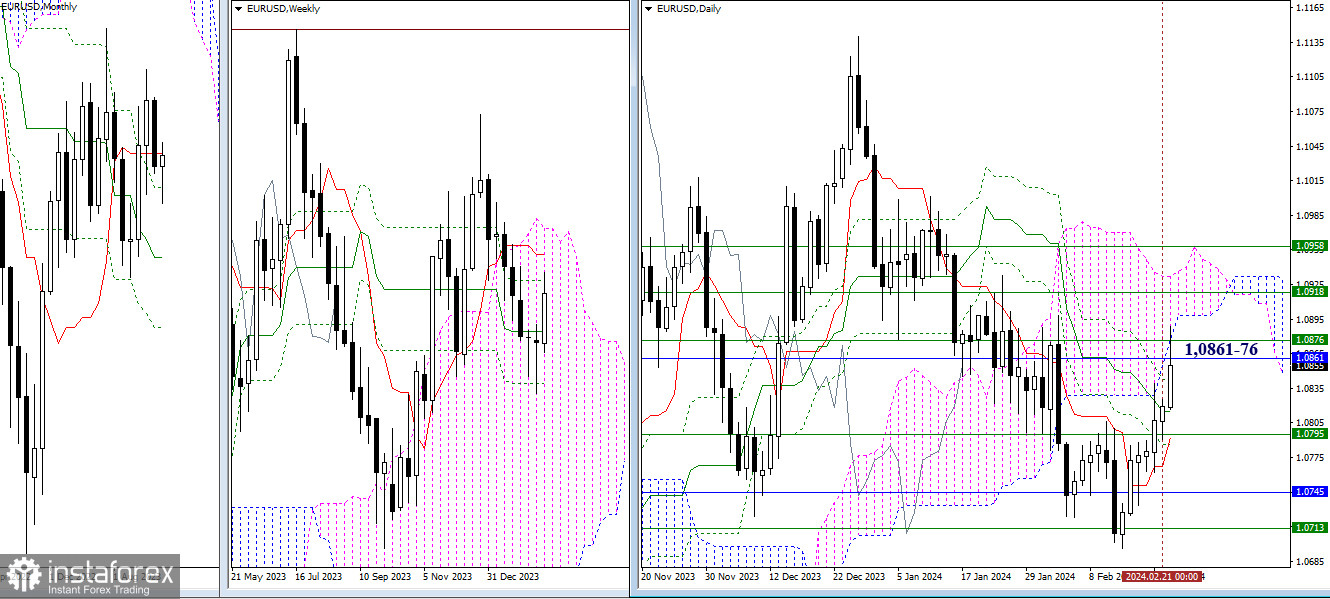
Yesterday was again devoid of activity, but today, the bullish players are already testing the previously marked resistances around 1.0861-76-78 (monthly short-term trend + weekly Fibonacci Kijun + lower boundary of the daily cloud). The outcome of this interaction can determine the prospects for the coming days. Current supports could be the levels of the daily Ichimoku cross at 1.0842 – 1.0815 – 1.0793, reinforced by the weekly medium-term trend (1.0795).

H4 – H1
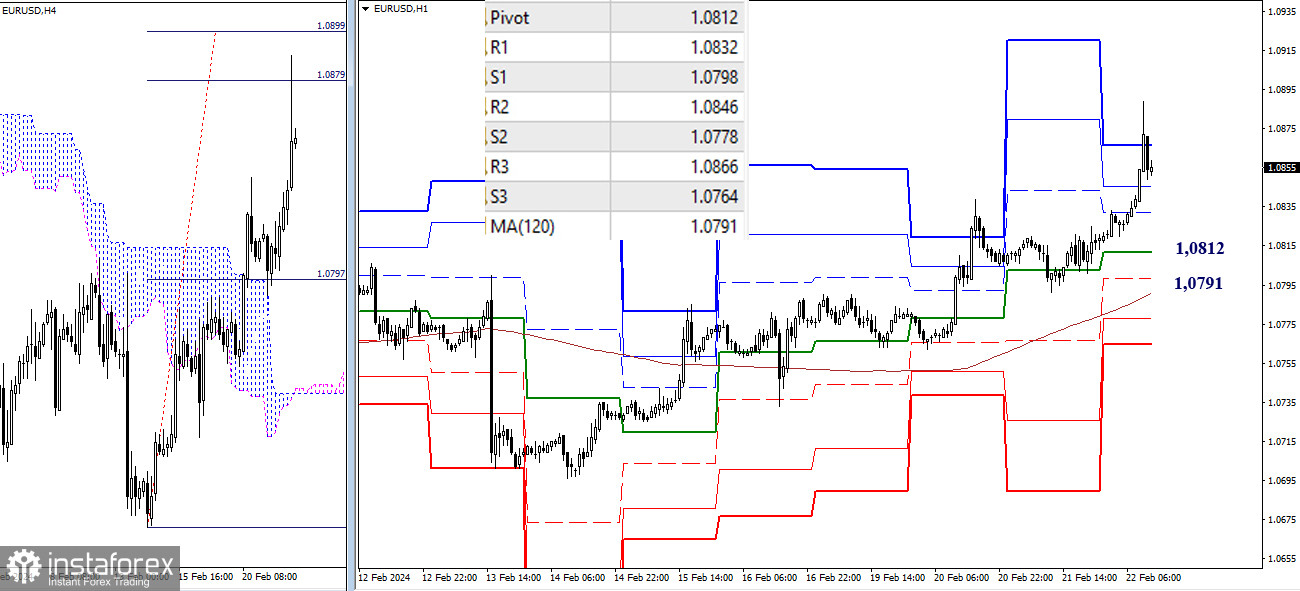
On the lower timeframes, bullish players have surpassed the resistances of classic pivot points and have started testing the benchmarks for the upward target for breaking the H4 cloud (1.0879-99). Key levels for the development of a possible downward correction are currently located at a significant distance from the price chart; nevertheless, in case of a decline, they will encounter the pair at 1.0812 (central pivot point of the day) and 1.0791 (weekly long-term trend).
***
GBP/USD

Higher Timeframes
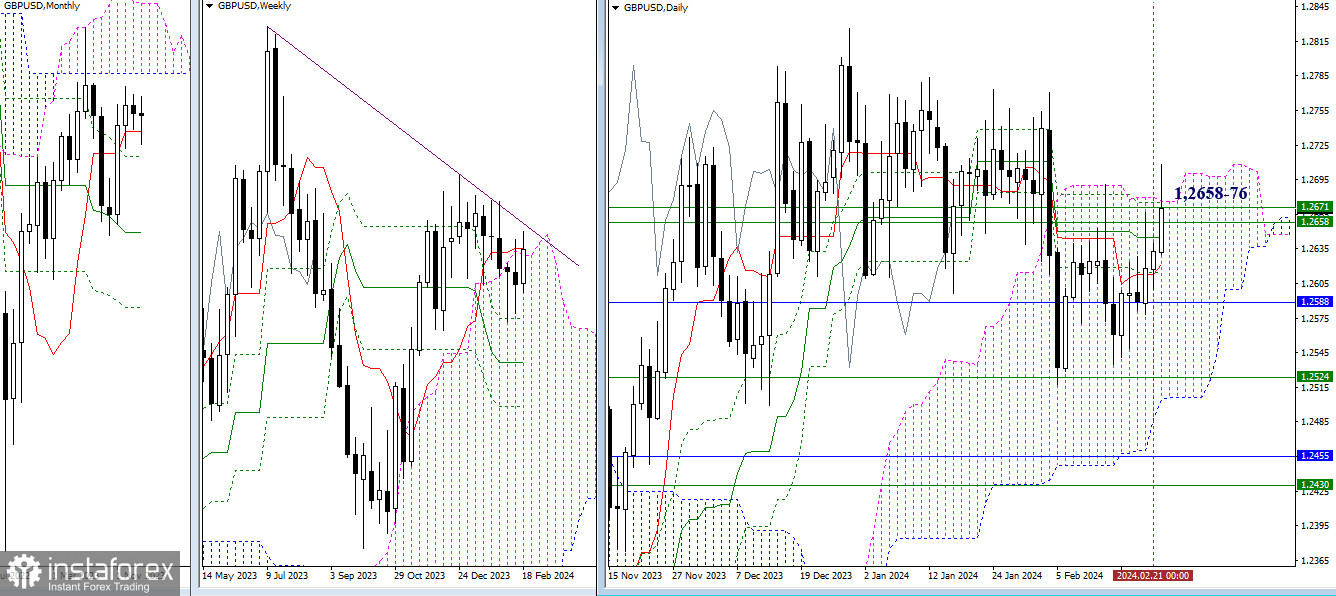
Bullish players aim to free themselves from the weight of looming resistances. Their main task now is to consolidate in the bullish zone relative to the daily and weekly clouds (1.2658-76), and it is important for them to break the weekly trend line. Current resistances (1.2645 – 1.2658 – 1.2671), which are now being tested for strength, may already act as supports on lower timeframes.

H4 – H1
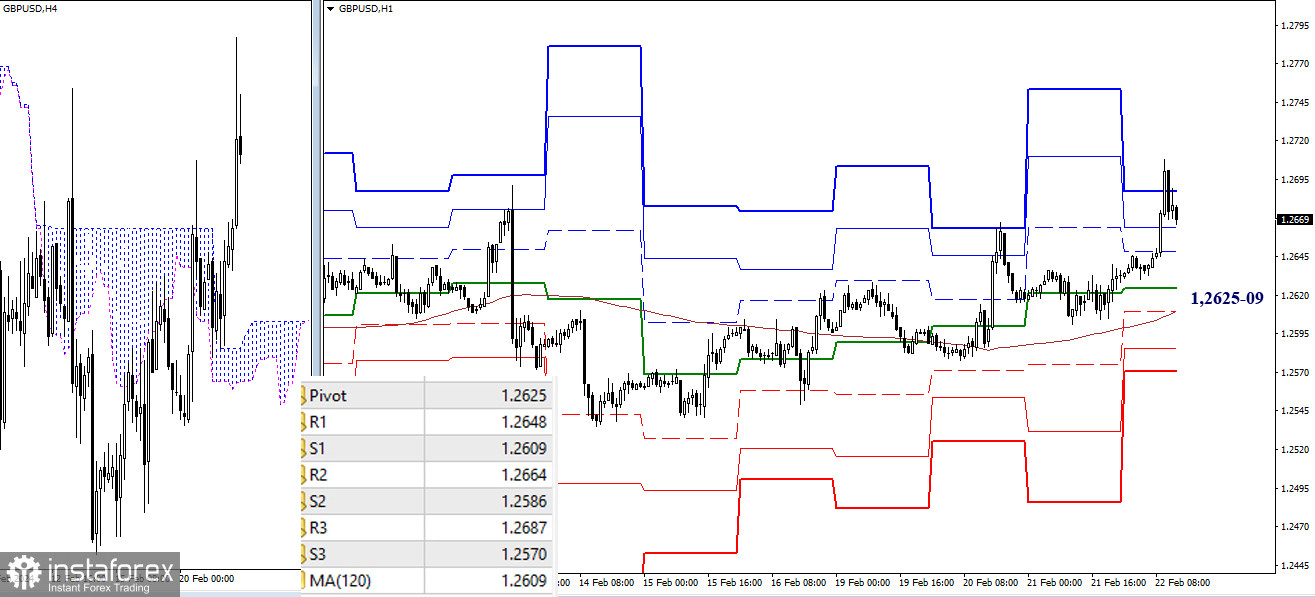
On the lower timeframes, the main advantage belongs to the bullish players. At the moment, the market has worked out all the upward benchmarks of lower timeframes. If the upward movement continues, attention will shift to the resistances of higher timeframes. If the current slowdown and emerging correction develop, the passed levels of classic pivot points may provide support. However, the main attention and significance during the downward correction will be given to key levels at 1.2625 (central pivot point) and 1.2609 (weekly long-term trend).
***
The technical analysis of the situation uses:
Higher timeframes - Ichimoku Kinko Hyo (9.26.52) + Fibonacci Kijun levels
Lower timeframes - H1 - Pivot Points (classic) + Moving Average 120 (weekly long-term trend)
 English
 Русский
 Bahasa Indonesia
 Bahasa Malay
 ไทย
ไทย Español
 Deutsch
 Български
 Français
 Tiếng Việt
 中文
中文 বাংলা
বাংলা हिन्दी
 Čeština
 Українська
 Română

