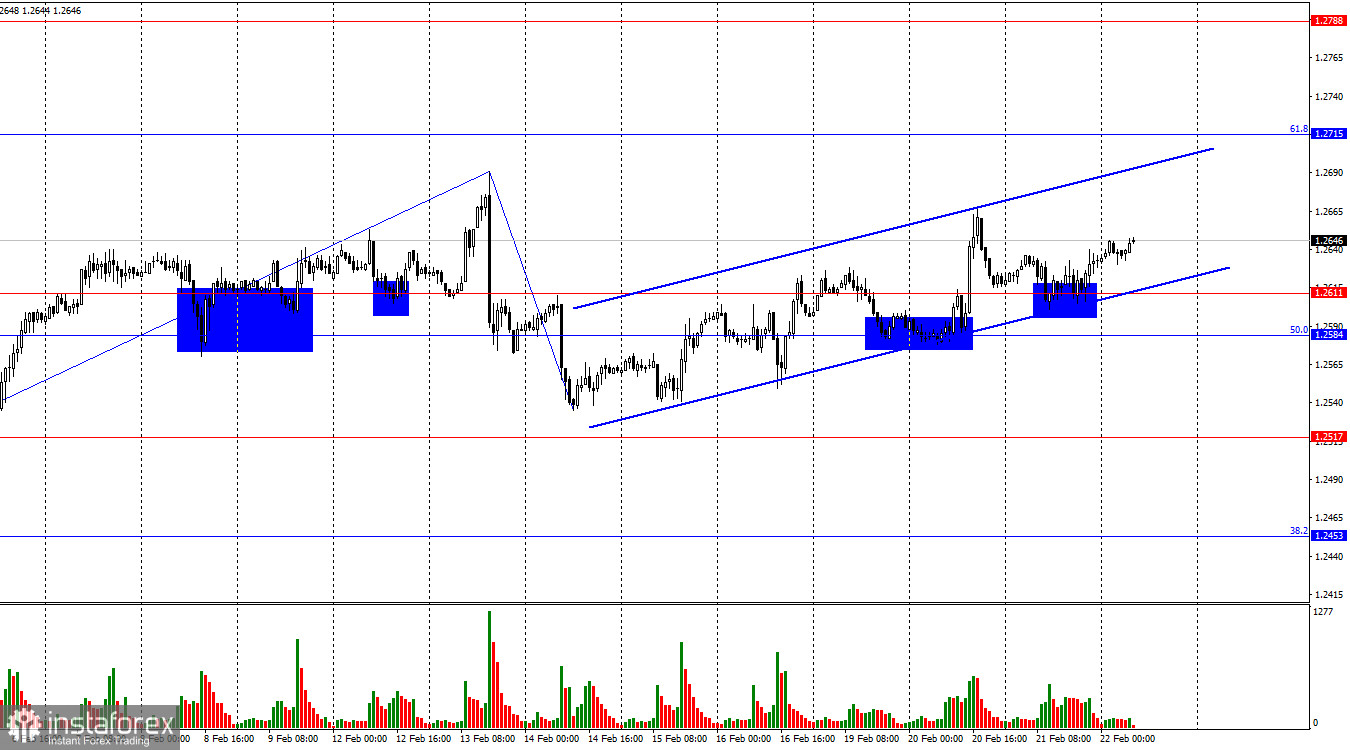
On the hourly chart, the GBP/USD pair executed another bounce from the support zone of 1.2584–1.2611 on Wednesday, once again allowing us to expect the British pound to rise towards the Fibonacci level of 61.8%–1.2715. The ascending trend channel supports bullish traders. I believe we are witnessing the formation of a new upward sequence, so the pound may reach 1.2715. Then, I expect a new decline in the pair.

The wave situation remains very ambiguous. For a long time, we observed horizontal movement, within which single waves or triplets were formed almost all the time, alternating with each other and having approximately the same size. The sideways movement is complete, and we continue to see the same single waves and triplets. Even confidence in the completion of the sideways movement diminishes day by day. Trader sentiment has shifted to "bearish," but bears have once again shown weakness. A new "bullish" corridor has now formed, and a new triplet may be upward.
Last night, the minutes of the latest FOMC meeting became known. It was stated that the Federal Reserve's interest rate has likely reached its peak, but lowering the rate at this time is impractical, as the FOMC still doubts the ability of inflation to decrease to 2%. Thus, the FOMC minutes, firstly, provided no new information to the market, and secondly, confirmed the persistence of the hawkish stance of the American regulator.
If the market had noticed this hawkish stance, the dollar should have risen. This did not happen, so I believe the current rise of the British pound and the euro is corrective, and it cannot last long.

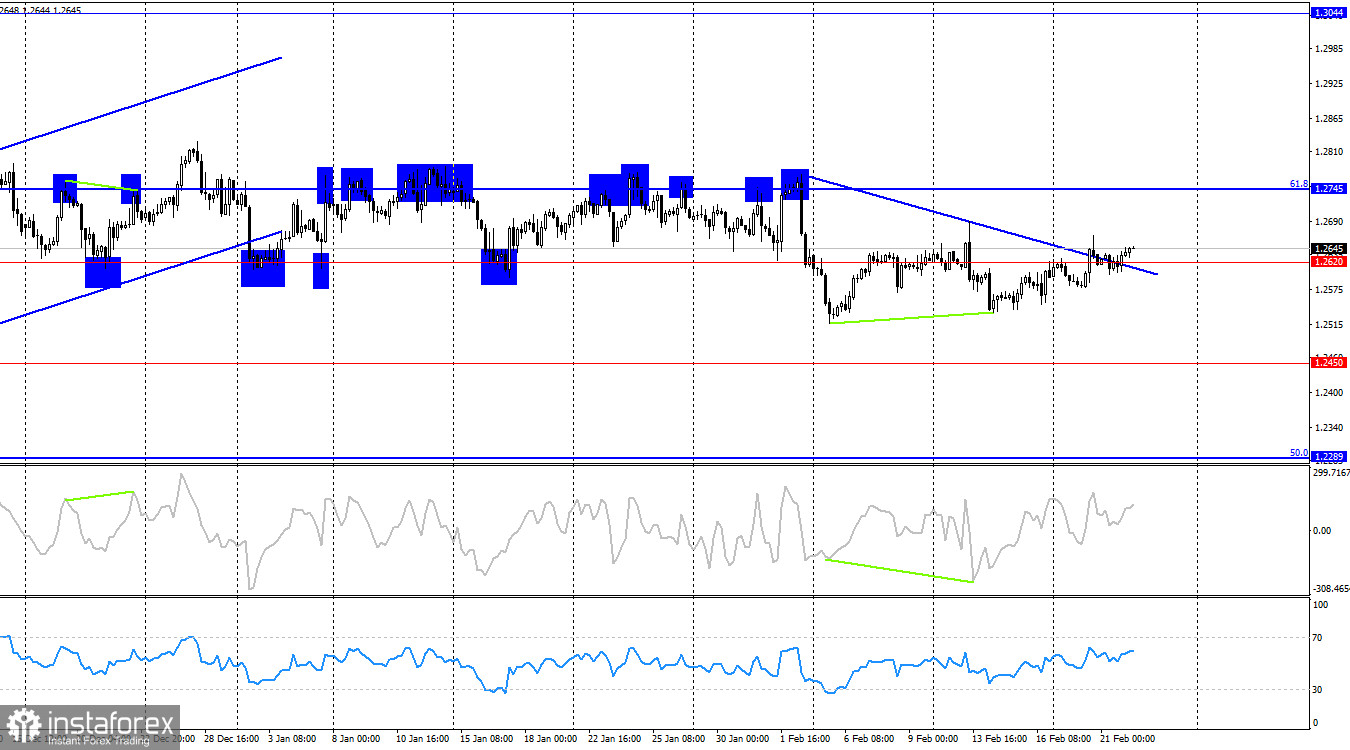
On the 4-hour chart, the pair retraced to the level of 1.2620 and the trendline. The pair's course consolidating above the trendline allows us to count on a continuation of the rise towards the corrective level of 61.8%–1.2745. However, it is not advisable to expect a new "bullish" trend at this time. A horizontal vector of movement is visible on all charts. Near the level of 1.2745, all the momentum of the bulls may end.
Commitments of Traders (COT) report:

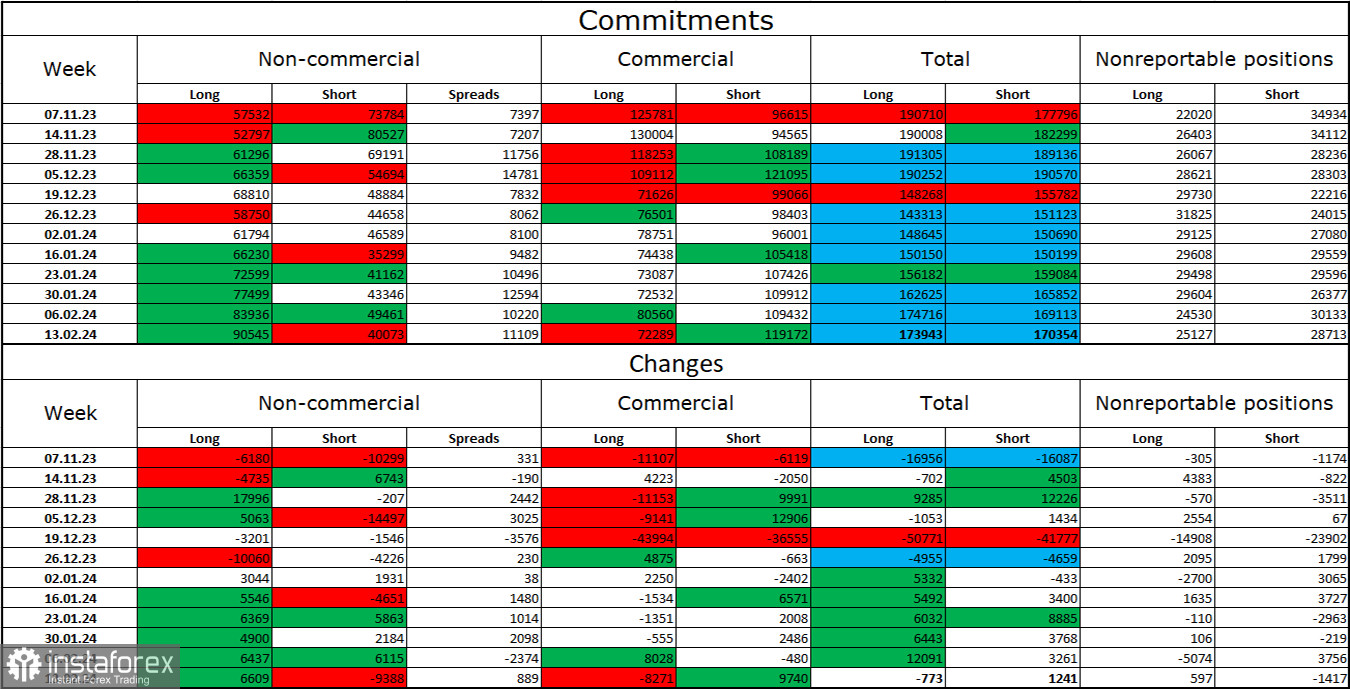
The sentiment in the "non-commercial" trader category changed quite strongly over the last reporting week. The number of long contracts held by speculators increased by 6609 units, while the number of short contracts decreased by 9388 units. The overall sentiment of major players remains "bullish" and continues to strengthen, although I see no specific reasons for this. There is more than a twofold gap between the number of long and short contracts: 90 thousand versus 40 thousand.
In my view, the British pound still has excellent prospects for a decline. I believe that over time, bulls will start getting rid of buy positions, as all possible factors for buying the British pound have already been exhausted. For two months, bulls have been unable to push the level of 1.2745, but bears are also not in a hurry to go on the offensive and are generally very weak now.
News calendar for the US and the UK:
UK – Services Purchasing Managers' Index (09:30 UTC).
UK – Manufacturing Purchasing Managers' Index (09:30 UTC).
UK – Composite Purchasing Managers' Index (09:30 UTC).
US – Initial Jobless Claims (13:30 UTC).
US – Services Purchasing Managers' Index (14:45 UTC).
US – Manufacturing Purchasing Managers' Index (14:45 UTC).
US – Composite Purchasing Managers' Index (14:45 UTC).
Thursday's economic events calendar contains numerous entries. The impact of the news background on market sentiment today can be quite strong.
GBP/USD Forecast and Trader Advice:
Today, selling can be considered if the pair consolidates below the ascending trend corridor on the hourly chart with a target of 1.2517. Purchases were possible when closing above the trendline on the 4-hour chart with a target of 1.2715. These trades can now be kept open, as another buy signal has formed on the hourly chart – a rebound from the zone of 1.2584–1.2611.
 English
 Русский
 Bahasa Indonesia
 Bahasa Malay
 ไทย
ไทย Español
 Deutsch
 Български
 Français
 Tiếng Việt
 中文
中文 বাংলা
বাংলা हिन्दी
 Čeština
 Українська
 Română

