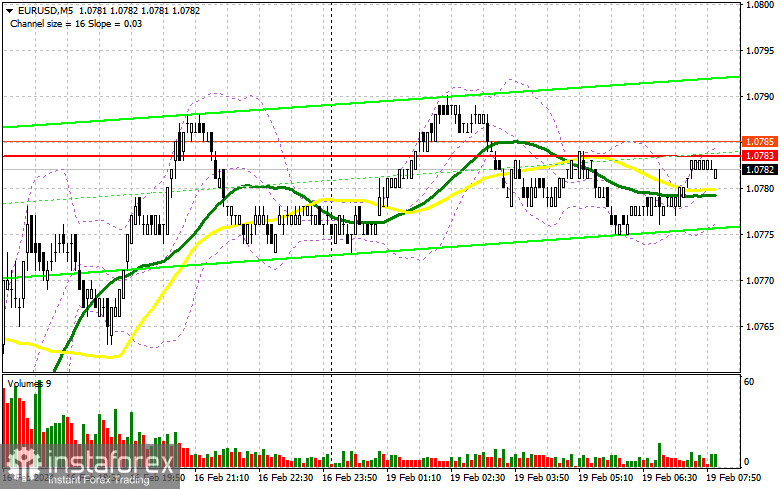
Last Friday I didn't find any market entry points. Let's take a look at the 5-minute chart and figure out what happened there. In my previous forecast, I paid attention to the level of 1.0783 and planned to make decisions on entering the market from there. EUR/USD grew indeed, but it never came to a false breakout. Due to low market volatility, the currency pair traded within the channel. In the afternoon, even though the US dollar reacted to the weak data, I still couldn't discover any suitable entry points into the market.
What is needed to open long positions on EUR/USD
The market neglected Friday's data on the German wholesale price index and the Italian consumer price index as reports of secondary importance. A series of statistics for the US, especially related to the real estate market, disappointed dollar buyers, which triggered an immediate rise in EUR/USD after the fall that was formed due to the news about rising producer prices. As a result, we observed the formation of an upward correction for the pair. Today, apart from the monthly report of the Bundesbank and the speech of B. Balz from the central bank, there is nothing that could affect the market direction, so the bulls have a chance to continue the correction.

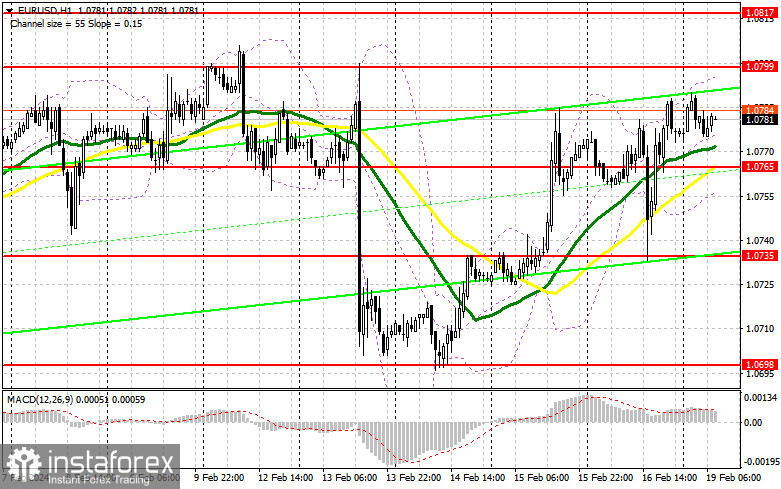
I would like to trade EUR/USD during its decline after the formation of a false breakout in the area of the nearest support 1.0765, formed on Friday. There are also moving averages that play on the side of the bulls. This will be a suitable condition for buying in anticipation of EUR/USD's continued growth to the area of 1.0799. A breakout and update from top to bottom of this range will give a chance to buy with a push to 1.0817. The highest target will be a maximum of 1.0840, where I will take profit. If EUR/USD declines and there is no activity at 1.0765 in the first half of the day, the pair will come again under selling pressure, which will return the market balance to the side of the bears. In this case, I plan to enter the market only after the formation of a false breakout in the area of 1.0735. I will open long positions immediately on a dip at 1.0698, bearing in mind an upward correction of 30-35 pips within the day.
What is needed to open short positions on EUR/USD
The bears pushed harder, but weak US data spoiled everything again. Now is the time to think about how to protect the nearest resistance at 1.0799 which could be tested in the near future. Protection and the formation of a false breakout there encouraged by the dovish stance of the Bundesbank policymakers will return pressure on the instrument, opening the way to the area of 1.0765, where the moving averages are located. A breakout and consolidation below this range, as well as a reverse test from bottom to top, will create another selling point with a collapse of EUR/USD to the area of 1.0735, which will revive the bearish trend. The lowest target will be at least 1.0698, where I will take profits. If EUR/USD moves up in the first half of the day, as well as amid the absence of bears at 1.0799, the buyers will have a chance for further recovery of the price. In this case, I will postpone selling until the test of the next resistance at 1.0817. I will also sell there, but only after unsuccessful consolidation. I plan to open short positions immediately on a rebound from 1.0840, bearing in mind a downward intraday correction of 30-35 pips.

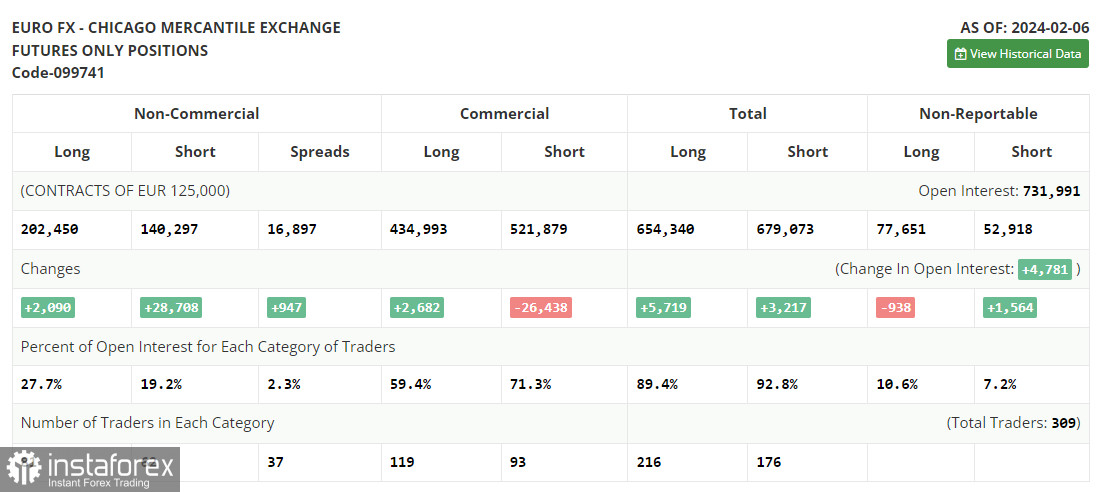
The COT (Commitment of Traders) report for February 6 showed an increase in both long and short positions. Obviously, after the meetings of the Federal Reserve and the European Central Bank, there are much more sellers of the euro, since everyone understands that no central bank is going to change monetary policy yet. Last week was quite calm, but we will get to know quite important data on inflation in the US in the near future, which can change sentiment in the market. The next jump in inflationary pressure will lead to a strengthening of the dollar's position and a sharp sell-off of the European currency, which, with a rather large delay, shows us an increase in short positions in EUR/USD. If inflation ebbs away, demand for risky assets will come into play. The COT report showed that long non-commercial positions increased by 2,090 to 202,450, while short non-commercial positions increased by 28,708 to the level of 140,297. As a result, the spread between long and short positions increased by 947.

Indicators' signals
Moving averages
The instrument is trading above the 30 and 50-day moving averages. It indicates a probable correction in EURUSD.
Note: The period and prices of the moving averages are considered by the analyst on the 1-hour chart and differ from the general definition of classic daily moving averages on the daily chart.
Bollinger Bands
In case EUR/USD goes down, the indicator's lower border at about 1.0755 will act as support.
Description of indicators
- Moving average (moving average, determines the current trend by smoothing out volatility and noise). Period 50. It is marked yellow on the chart.
- Moving average (moving average, determines the current trend by smoothing out volatility and noise). Period 30. It is marked green on the chart.
- MACD indicator (Moving Average Convergence/Divergence — convergence/divergence of moving averages). Quick EMA period 12. Slow EMA period to 26. SMA period 9
- Bollinger Bands (Bollinger Bands). Period 20
- Non-commercial speculative traders, such as individual traders, hedge funds, and large institutions that use the futures market for speculative purposes and meet certain requirements.
- Long non-commercial positions represent the total long open position of non-commercial traders.
- Short non-commercial positions represent the total short open position of non-commercial traders.
- Total non-commercial net position is the difference between short and long positions of non-commercial traders.
 English
 Русский
 Bahasa Indonesia
 Bahasa Malay
 ไทย
ไทย Español
 Deutsch
 Български
 Français
 Tiếng Việt
 中文
中文 বাংলা
বাংলা हिन्दी
 Čeština
 Українська
 Română

