EUR/USD

Higher Timeframes
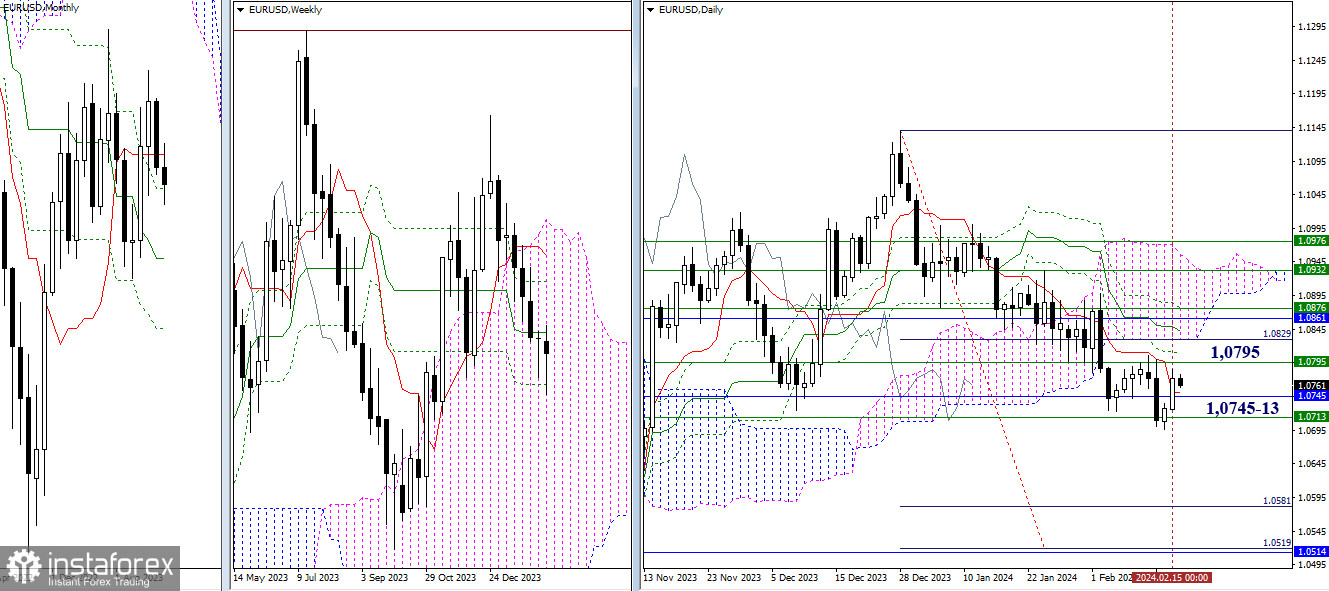
Bulls developed a corrective ascent on Thursday, closing the day above the daily short-term trend and approaching a relatively wide resistance zone, the main levels of which can be identified today at 1.0795 – 1.0829 – 1.0861 – 1.0876. Any of these levels may cause a slowdown. Breaking through the mentioned resistance zone will eliminate the death cross on the daily chart and break the trendline of the weekly correction. The situation after breaking through the resistance zone will be better reassessed.
The completion of the current daily correction is possible only after the pair manages to overcome the supports of the weekly (1.0713) and monthly (1.0745) Fibonacci Kijuns, as well as update the low (1.0696), restoring the downward trend of the day.

H4 – H1
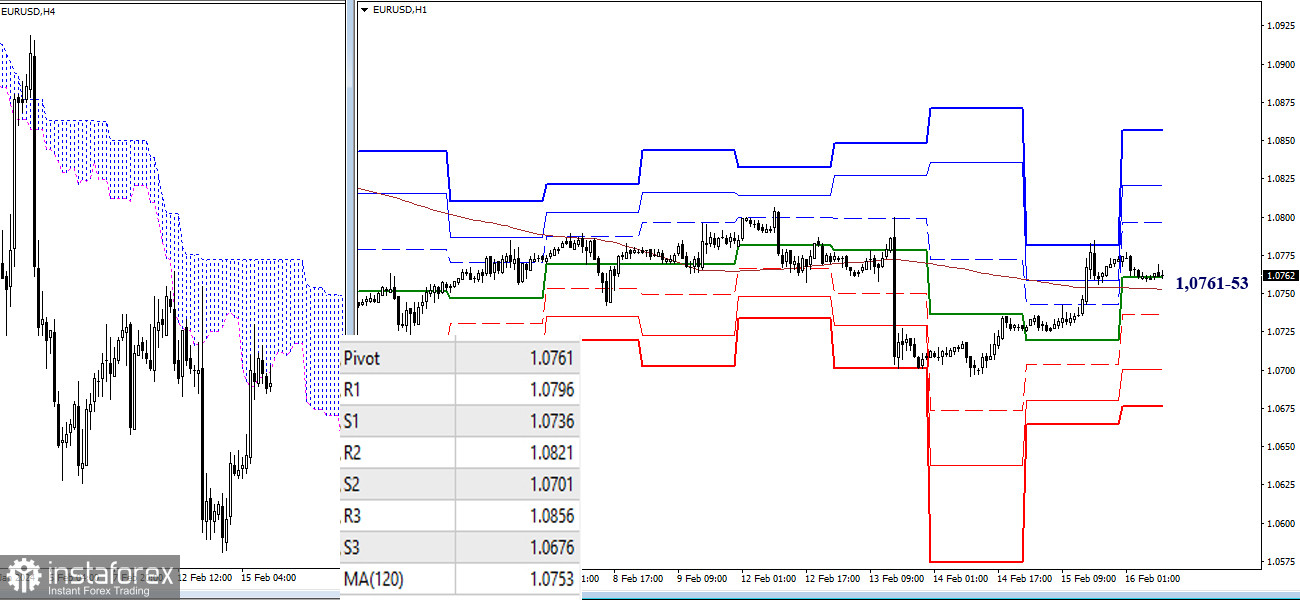
As of writing, the pair is above key levels, which today converge around 1.0761-53 (central pivot point + weekly long-term trend). The development of bullish sentiments within the day may occur by breaking through the resistances of classic pivot points (1.0796 – 1.0821 – 1.0856). Losing key levels can change the current balance of power, and further decline can be realized by breaking the supports of classic pivot points (1.0736 – 1.0701 – 1.0676).
***
GBP/USD

Higher Timeframes
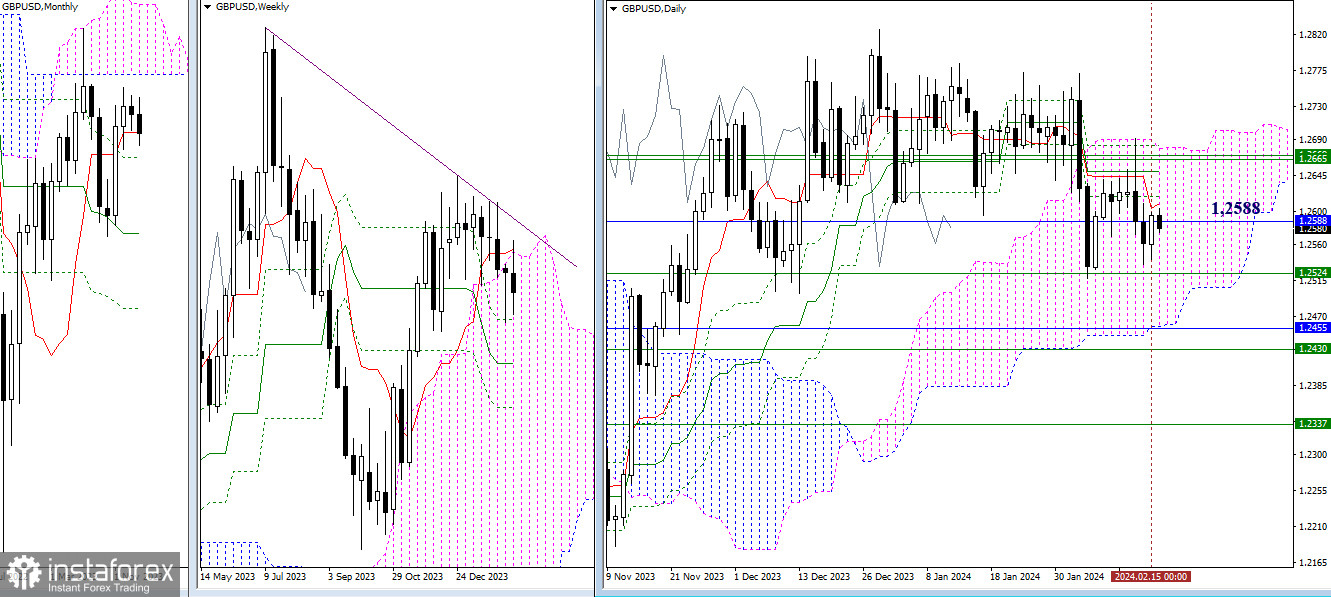
The pair closed yesterday above the monthly short-term trend (1.2588). As of now, the decline has stopped. If the current pause realizes as a corrective rise, the main task for bulls will be to eliminate the death cross on the daily chart (1.2610 – 1.2651 – 1.2682) and consolidate in the bullish zone relative to the daily cloud (1.2679). Simultaneously, bulls will be able to exit the weekly cloud (1.2669) and take control of the weekly short-term trend (1.2671). If the pause ends, a new phase of bearish activity can be expected after breaking the weekly support (1.2524) and updating the low (1.2517).

H4 – H1
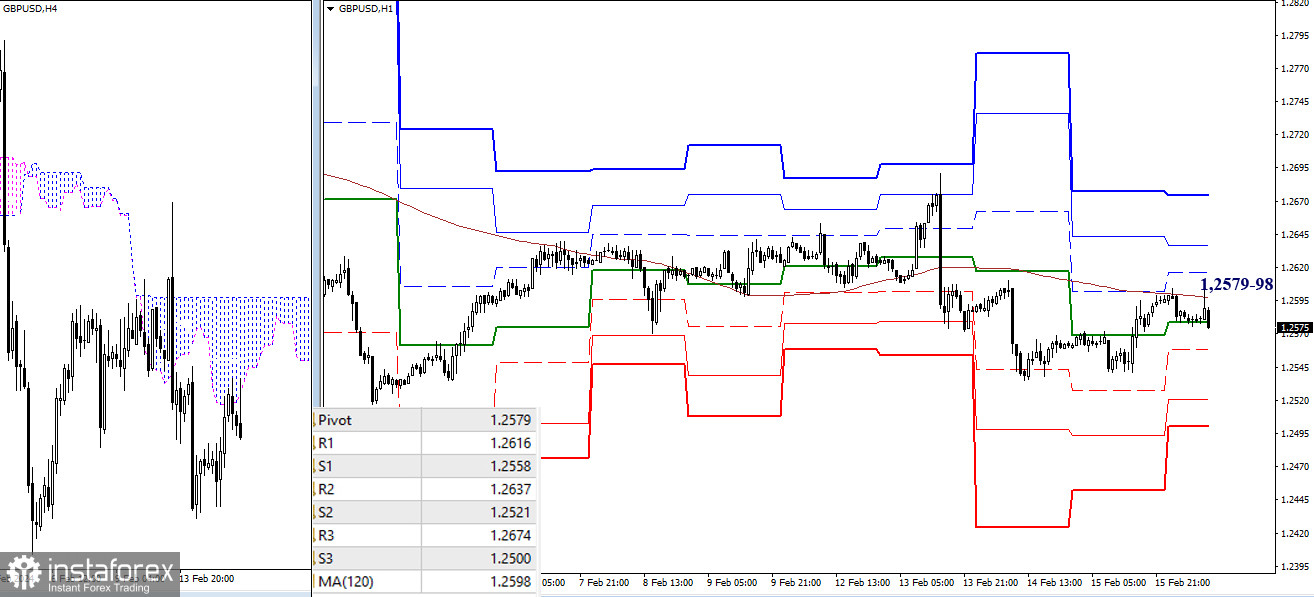
Bulls seek to regain possession of the weekly long-term trend (1.2598). By acquiring the level, bulls can direct attention to the resistances of classic pivot points (1.2616 – 1.2637 – 1.2674). In case of a rebound and the restoration of bears' positions, market interests will be redirected towards passing through the supports of classic pivot points, located today at the thresholds of 1.2558 – 1.2521 – 1.2500.
***
The technical analysis of the situation uses:
Higher timeframes - Ichimoku Kinko Hyo (9.26.52) + Fibonacci Kijun levels
Lower timeframes - H1 - Pivot Points (classic) + Moving Average 120 (weekly long-term trend)
 English
 Русский
 Bahasa Indonesia
 Bahasa Malay
 ไทย
ไทย Español
 Deutsch
 Български
 Français
 Tiếng Việt
 中文
中文 বাংলা
বাংলা हिन्दी
 Čeština
 Українська
 Română

