Over the past couple of days, the euro area showed better-than-expected economic reports, while U.S. data showed surprising results. For instance, instead of accelerating from 5.6% to 5.8%, retail sales tumbled 0.8% last month. In addition to that, the previous results were revised downward, so the growth rate slowed down from 5.3%. And instead of accelerating from 1.0% to 1.2%, industrial production fell by 0.1%. Fortunately, the previous data was revised upwards. But we can hardly consider this as a positive moment.
Of course, the discrepancies are not as massive as in Europe, where the decline in a number of indicators was replaced by growth and we did not see a decline in either retail sales or industrial production. Nevertheless, the industry has already approached the line where it starts to decline. In general, it's not surprising that the dollar rapidly lost its positions. And it is quite possible that it will continue to do so today. After all, the market practically ignored strong economic reports from Europe, largely because such optimistic data raised some doubts. But in the face of extremely weak U.S. data, the market may start to play them back. Perhaps it will take some time.

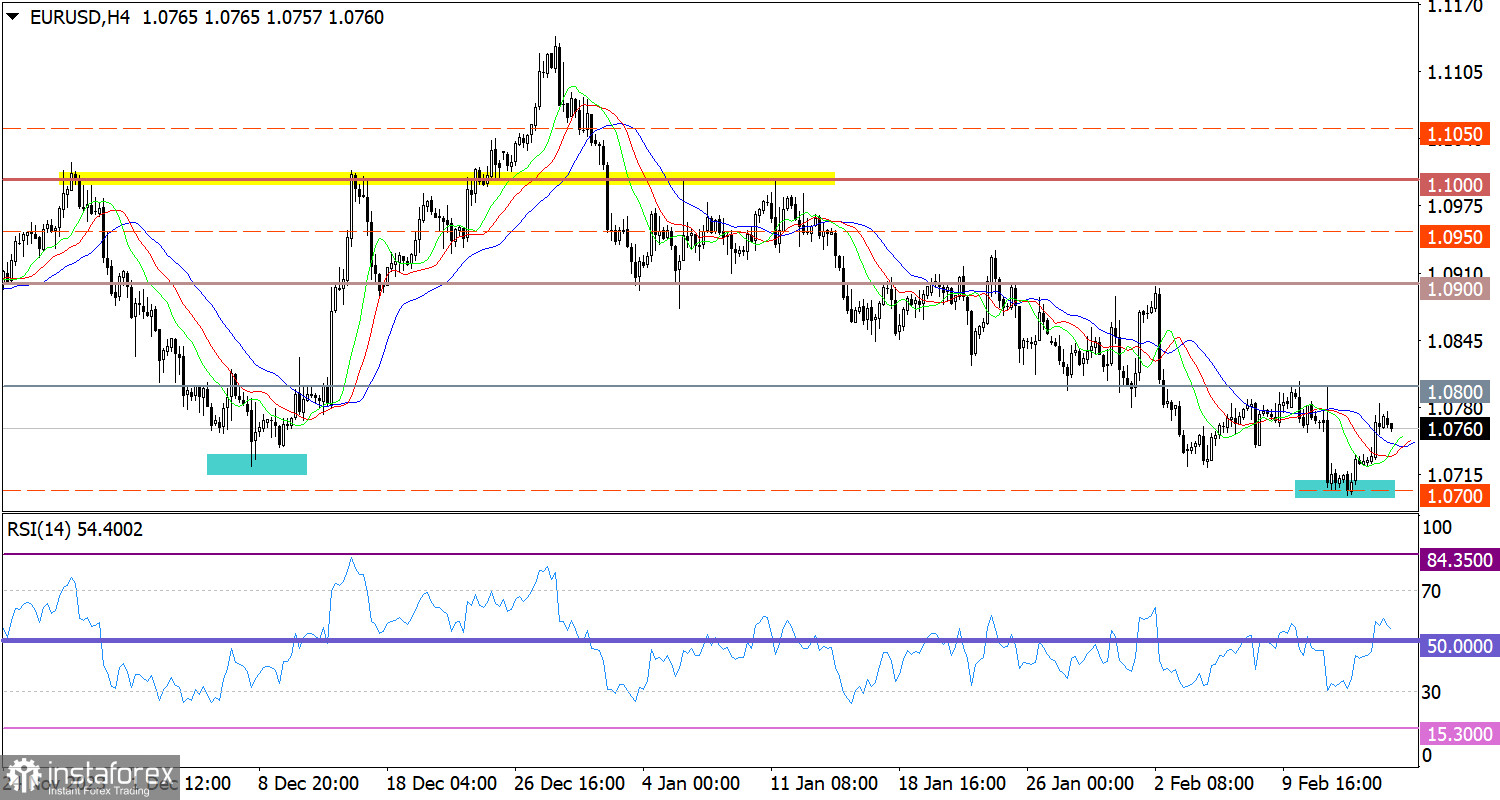
During a pullback from the support level of 1.0700, EUR/USD almost reached the resistance level of 1.0800, where the volume of long positions decreased.
On the 4-hour and 1-hour charts, the RSI technical indicator showed a strong signal of the euro's overbought condition. The indicator exceeded the 81 mark, precisely at the time when there was a convergence with the level of 1.0800.
Meanwhile, the Alligator's MAs are intertwined in the 4-hour chart, indicating a slowdown in the downward cycle.
Outlook
In order to raise the volume of long positions, the price must settle above the level of 1.0800 during the day. Otherwise, this level may act as resistance, strengthening short positions, and the price could move towards 1.0700.
The complex indicator analysis signals a decline in buying volumes in the short-term period, while indicators in the intraday period point to an upward cycle.
 English
 Русский
 Bahasa Indonesia
 Bahasa Malay
 ไทย
ไทย Español
 Deutsch
 Български
 Français
 Tiếng Việt
 中文
中文 বাংলা
বাংলা हिन्दी
 Čeština
 Українська
 Română

