Analysis of GBP/USD 5M

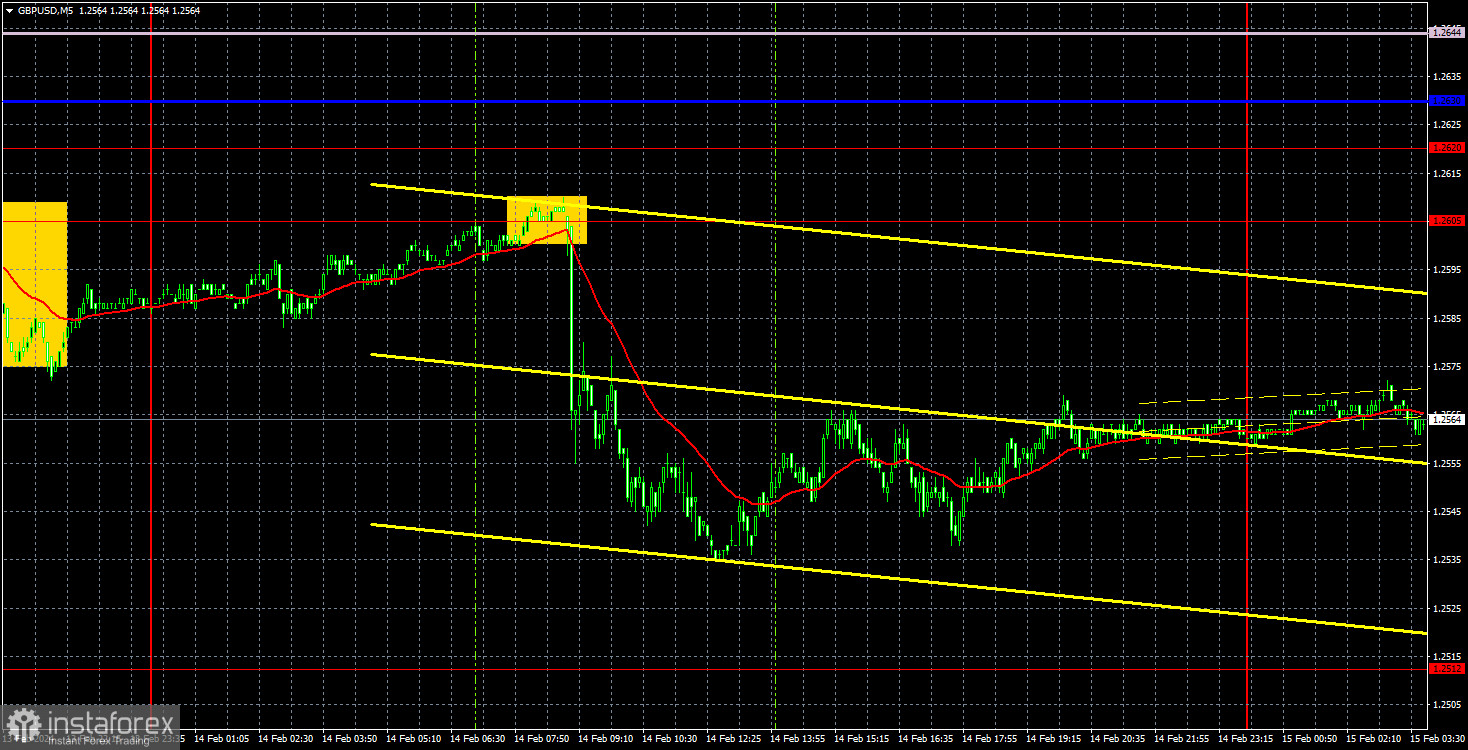
GBP/USD corrected slightly higher on Wednesday, but this happened after another slump. In fact, the British currency didn't lose a lot in the last two days. If we consider the preceding rise on Tuesday, the pound fell by only 50-60 pips in total over the two days. This is despite two crucial inflation reports being released in the UK and the US, both of which supported the dollar. Therefore, despite the slump, we noticed that the market is not eager to sell the pound and buy the dollar.
We have already discussed the reasons in the past. Basically, there can only be one reason: the market does not expect the Bank of England to make a swift transition to a more dovish monetary policy. Take note that the euro is falling at the same time. And this isn't due to the economic data, as the state of the eurozone economy is no better than that of the UK. But inflation in Britain remains high, and BoE Governor Andrew Bailey and his company are sending the market very discreet signals about a shift to a less hawkish policy.
Yesterday's UK CPI data showed that inflation remained unchanged, and today, GDP and industrial production data may provide impetus. The pound could easily recover by 50-60 pips (mentioned earlier) if these two reports exceed expectations. And it will be very easy to do, as the forecasts are quite pessimistic. Therefore, in the coming days, the pound may even start a new upward movement.
Only one signal was generated on Wednesday. At the beginning of the European session, the pair bounced off the level of 1.2605, after which it managed to fall by about 45-50 pips. It was very difficult to enter a short position in time, since the pair was rapidly falling. Nevertheless, traders could still earn profit from the short positions.
COT report:
COT reports on the British pound showed a bullish bias. According to the latest report on the British pound, the non-commercial group opened 6,400 buy contracts and 6,100 short ones. As a result, the net position of non-commercial traders increased by 300 contracts in a week. The size of the net position implies that the number of long positions had not decreased, so the COT report does not suggest that the pound will start a pronounced decline. The fundamental background still does not provide grounds for long-term purchases of the British currency, but we can't confirm that this supports the downward movement.
The non-commercial group currently has a total of 83,900 buy contracts and 49,500 sell contracts. Since the COT reports do not provide an accurate forecast of the market's behavior at the moment, we need to pay close attention to the technical picture and economic reports. The technical analysis suggests that there's a possibility that the pound could show a pronounced downward movement, and for a long time now, the economic reports have also been significantly stronger in the United States than in the United Kingdom, but this has not benefited the dollar.
Analysis of GBP/USD 1H

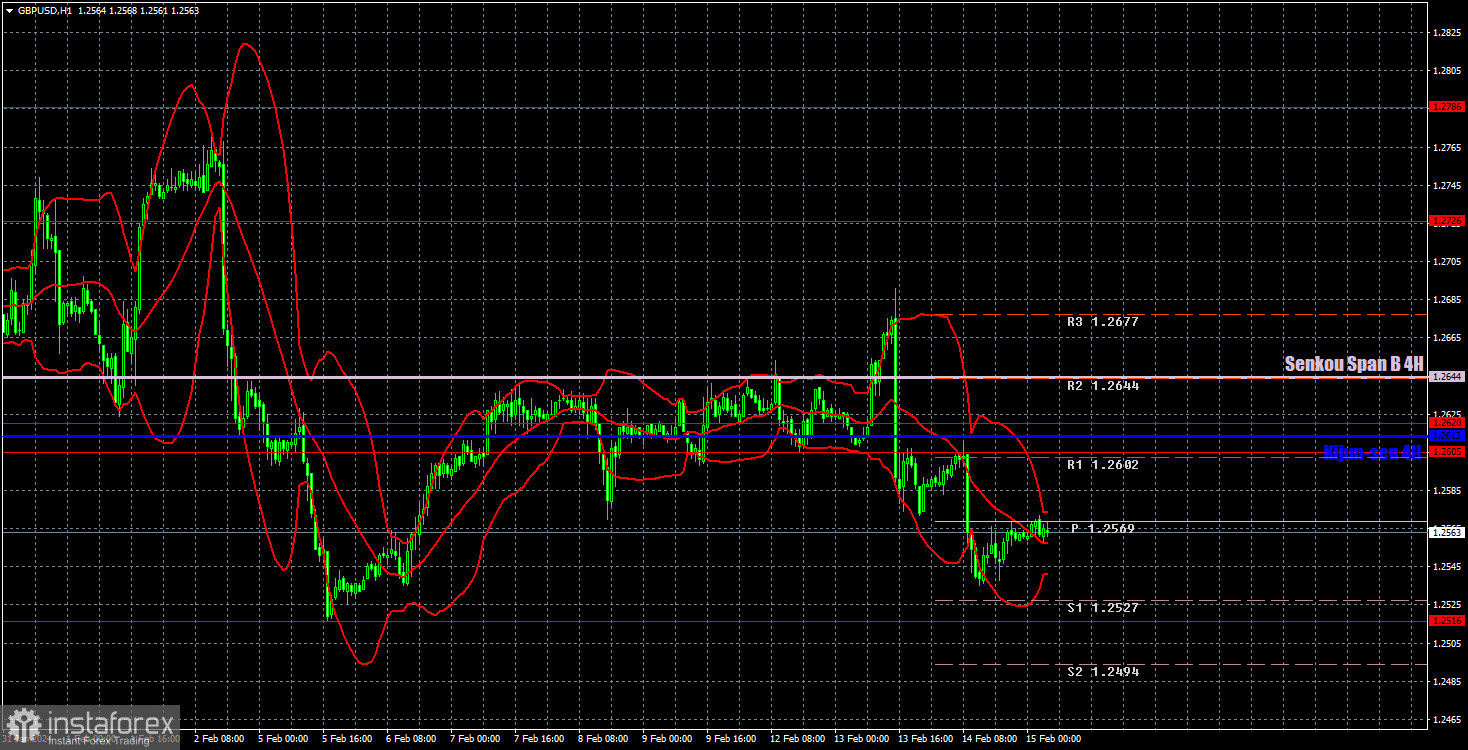
On the 1H chart, GBP/USD left the sideways channel and it may be on track to form a downtrend. However, recently, we've noticed that the market is not in a rush to sell the pound. Hopefully, this is a temporary situation, but for now, the price has been moving sideways instead of moving downwards. The British pound is still a currency that tends to move sideways, trading in a somewhat illogical and confusing manner.
As of February 15, we highlight the following important levels: 1.2215, 1.2269, 1.2349, 1.2429-1.2445, 1.2516, 1.2605-1.2620, 1.2726, 1.2786, 1.2863, 1.2981-1.2987. The Senkou Span B (1.2644) and Kijun-sen (1.2613) lines can also serve as sources of signals. Don't forget to set a Stop Loss to breakeven if the price has moved in the intended direction by 20 pips. The Ichimoku indicator lines may move during the day, so this should be taken into account when determining trading signals.
On Thursday, the UK will release reports on industrial production and GDP. These reports may have a moderate impact on market sentiment. The U.S. will release secondary reports, which may have a minor influence on the pair's movement.
Description of the chart:
Support and resistance levels are thick red lines near which the trend may end. They do not provide trading signals;
The Kijun-sen and Senkou Span B lines are the lines of the Ichimoku indicator, plotted to the 1H timeframe from the 4H one. They provide trading signals;
Extreme levels are thin red lines from which the price bounced earlier. They provide trading signals;
Yellow lines are trend lines, trend channels, and any other technical patterns;
Indicator 1 on the COT charts is the net position size for each category of traders;
Indicator 2 on the COT charts is the net position size for the Non-commercial group.
 English
 Русский
 Bahasa Indonesia
 Bahasa Malay
 ไทย
ไทย Español
 Deutsch
 Български
 Français
 Tiếng Việt
 中文
中文 বাংলা
বাংলা हिन्दी
 Čeština
 Українська
 Română

