EUR/USD

Higher Timeframes
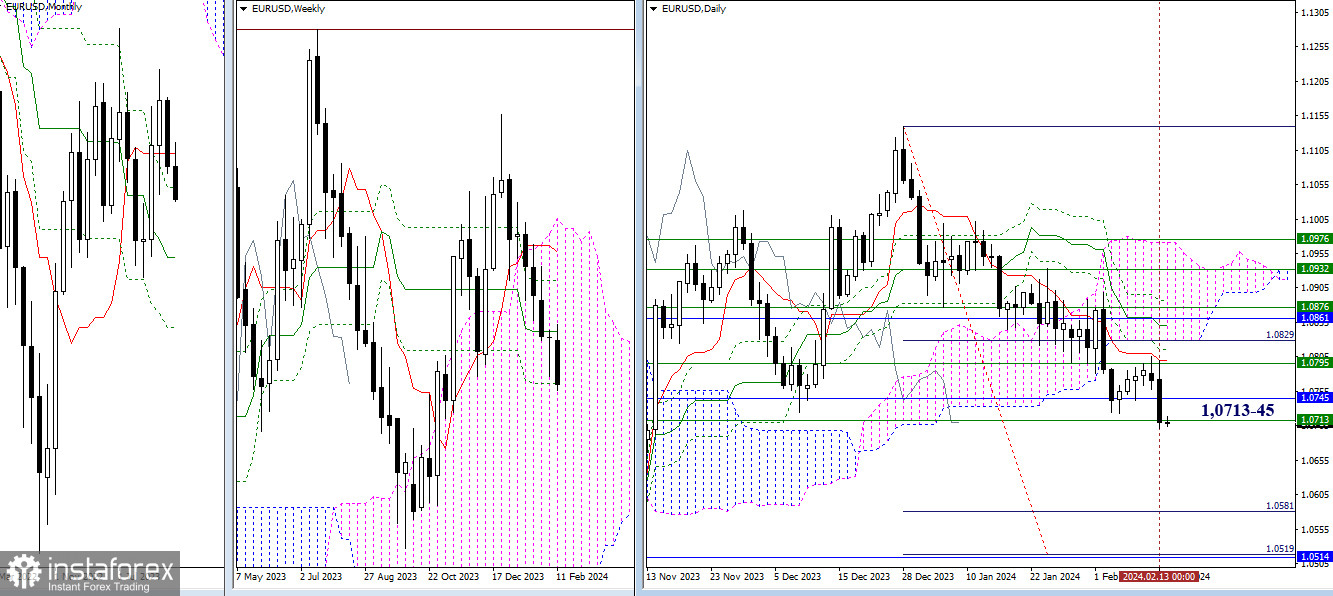
Bearish players were the first to attempt to change the situation. Yesterday, they declined to the final support of the weekly Ichimoku death cross (1.0713). At the moment, the strength and attraction of the monthly and weekly boundaries at 1.0745 - 1.0713 may influence, slow down, or even force bears to abandon breakdown plans. If the bears succeed in their task, breaking the support will open the way to the target levels for breaking the daily cloud (1.0519-81), reinforced by the monthly medium-term trend (1.0514).

H4 - H1
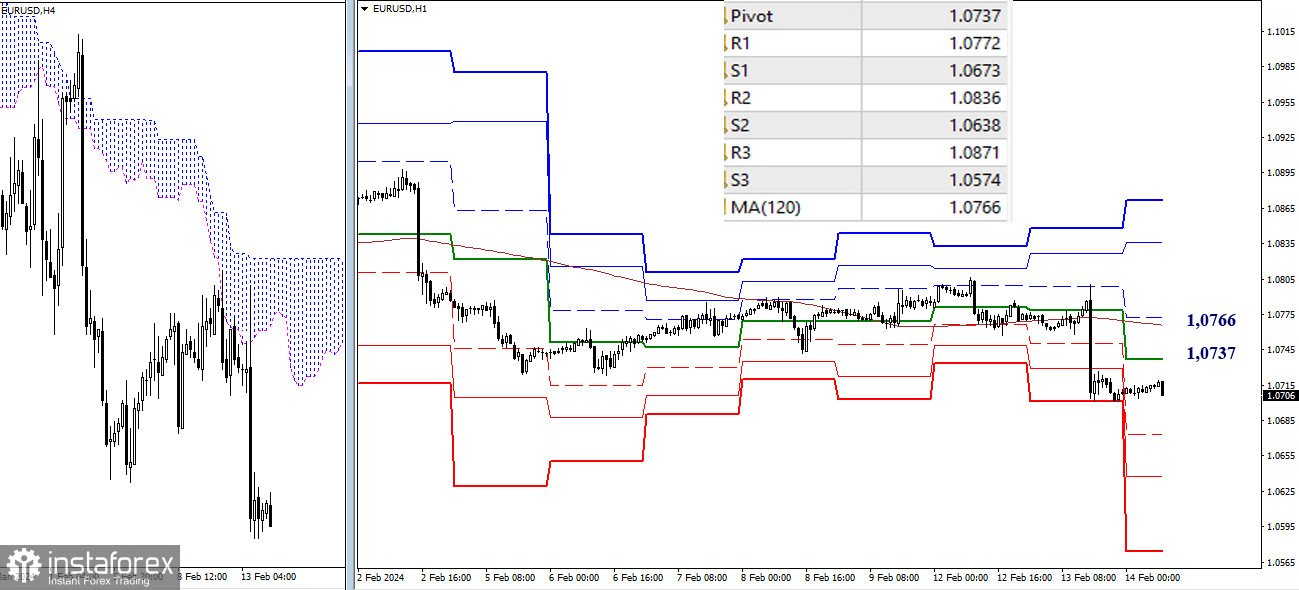
On the lower timeframes, the main advantage currently belongs to bears. Updating yesterday's low (1.0701) will allow the continuation of the downward trend. Intraday supports are provided by classic pivot points, today located at 1.0673 - 1.0638 - 1.0574. If bulls decide to resume positions, the most important aspect will be the consolidation above key levels. Key levels today form correction boundaries at 1.0737 - 1.0766 (central pivot point + weekly long-term trend). By consolidating above, bulls can develop advantages within the day by overcoming resistance levels of classic pivot points (1.0772 - 1.0836 - 1.0871).
***
GBP/USD

Higher Timeframes
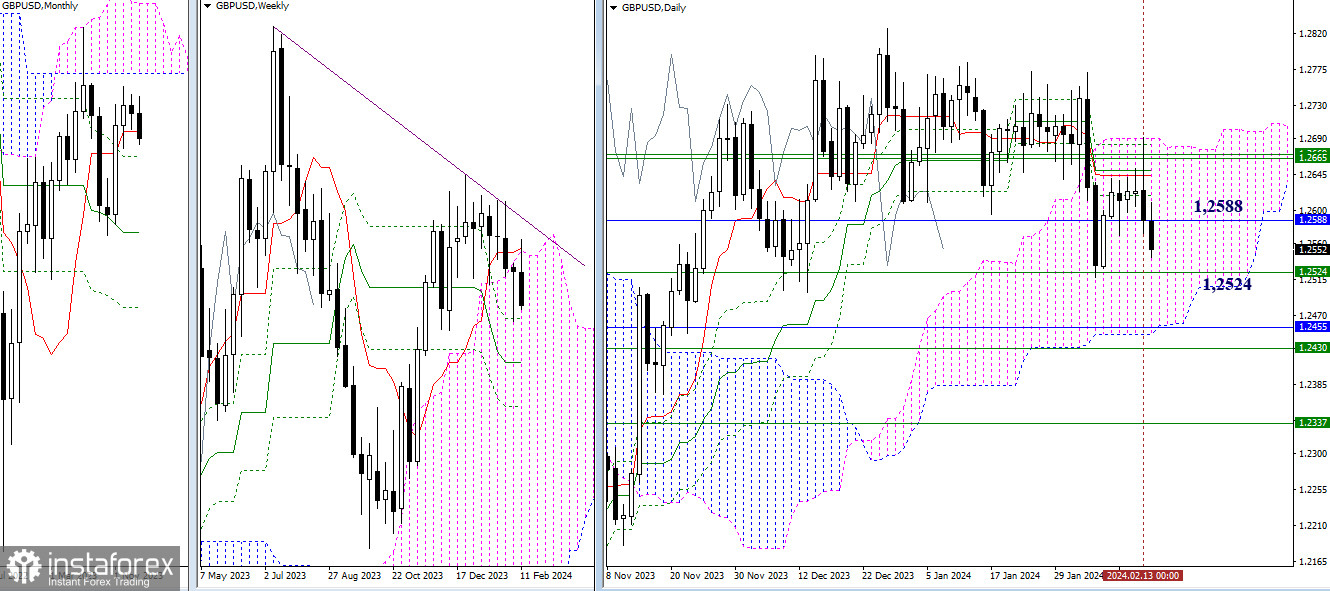
The recent testing of resistances yesterday was quite abruptly replaced by bearish activity and a decline towards the support zone of the monthly short-term trend (1.2588). This level can attract and restrain the development of the situation. Today, bears continue their movement, and ahead of them is the weekly Fibonacci Kijun (1.2524). Further market events depend on the result of interaction with the indicated boundaries.

H4 - H1
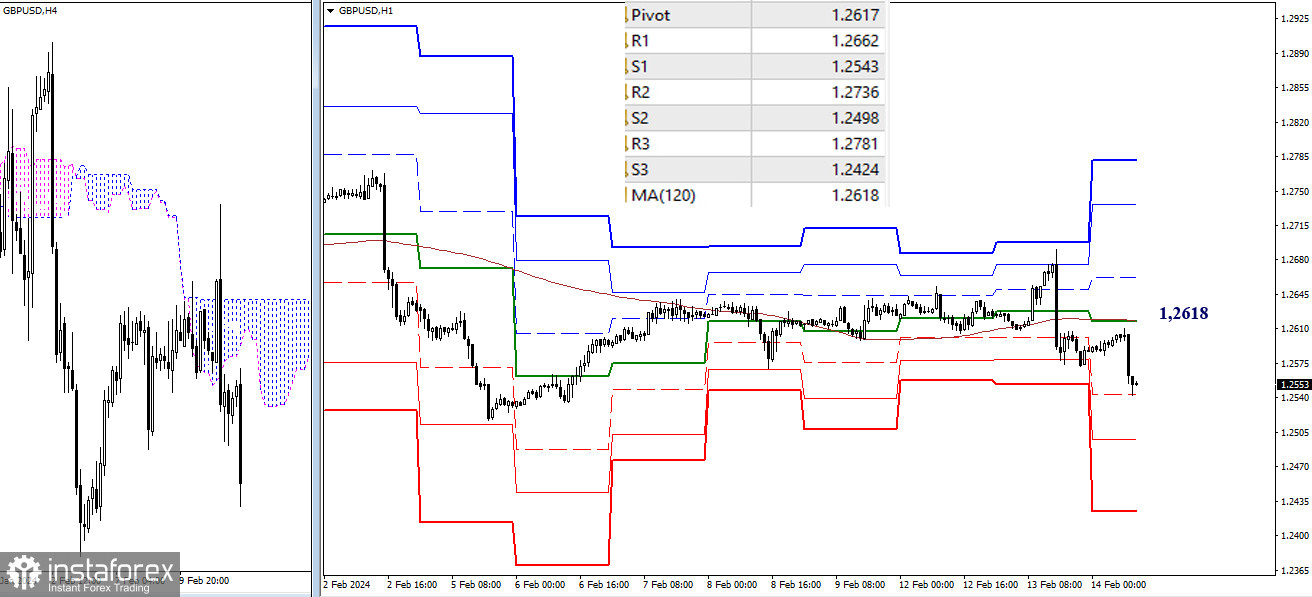
On the lower timeframes, bears seek to develop their advantage. Currently, the first support of classic pivot points is being tested (1.2543), and then S2 (1.2498) and S3 (1.2424) are waiting their turn. Key levels today have merged at the boundary of 1.2618 (central pivot point of the day + weekly long-term trend). They continue to remain in a horizontal position, preferring uncertainty and insecurity in bearish forces. Consolidating above key levels may shift the advantage and prospects to bullish players.
***
The technical analysis of the situation uses:
Higher timeframes - Ichimoku Kinko Hyo (9.26.52) + Fibonacci Kijun levels
Lower timeframes - H1 - Pivot Points (classic) + Moving Average 120 (weekly long-term trend)
 English
 Русский
 Bahasa Indonesia
 Bahasa Malay
 ไทย
ไทย Español
 Deutsch
 Български
 Français
 Tiếng Việt
 中文
中文 বাংলা
বাংলা हिन्दी
 Čeština
 Українська
 Română

