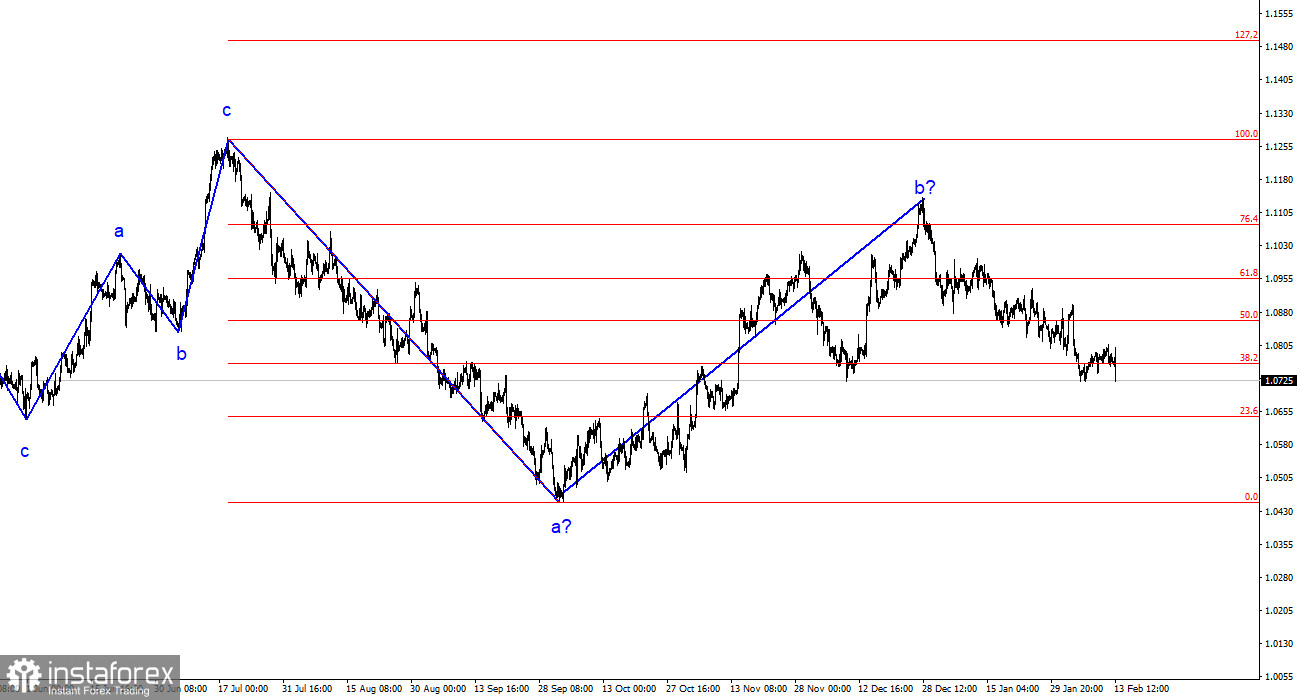
The wave analysis of the 4-hour chart for the EUR/USD pair remains unchanged. In the past year, we have seen only three-wave structures that constantly alternate with each other. At the moment, the construction of another three-wave downtrend continues. The presumed wave 1 is completed, wave 2 or b has complicated three or four times, but at the moment, it can still be considered conditionally completed since the decline of the pair has been ongoing for over a month.
The ascending segment of the trend may be resumed, but its internal structure will be unreadable in this case. I remind you that I try to highlight unambiguous wave structures that do not tolerate dual interpretation. If the current wave analysis is correct, the market has moved on to forming wave 3 or c. A successful attempt to break the 1.0788 level, which corresponds to 76.4% Fibonacci, once again confirmed the market's readiness for sales. Now the nearest target is the 1.0637 level, which is equivalent to 100.0% Fibonacci. But even at this point, I do not expect the decline of the euro currency to be completed. Wave 3 or c should be much more prolonged both in time and in targets.
Demand for the euro continues to fall under the pressure of statistics
The exchange rate of the EUR/USD pair fell by 60 basis points on Tuesday, but by the end of the day, the losses of the European currency could be much more significant. In many ways, today's events boiled down to the US inflation report. I can't say that its value shocked market participants, but judging by their reaction, it seems that this is exactly what happened.
We should start with what the market expects to see. From the core inflation (which has recently become even more important than the headline), the market expected a slowdown to 3.7% on an annual basis. Core inflation was supposed to slow down to 2.9%-3.1% year-on-year. However, the actual figures for January turned out to be somewhat different. The core indicator remained unchanged and stayed at 3.9%, and the core indicator decreased but only to 3.1%. It is difficult to say whether the market was expecting a greater slowdown from core inflation or was hoping for at least some slowdown from the core, but it can be said with confidence that it cannot be satisfied with these figures.
Based on all of the above, it becomes evident that there is no longer any reason to hurry with a rate cut by the FOMC after Tuesday. The probability of a rate cut in March, according to the CME FedWatch tool, immediately dropped to 7.5%, and demand for the US currency sharply increased. The construction of the downtrend wave 3 or c, accordingly, continues, and I expect the pair to go much lower than the current levels. Ahead of this week, there will be several more important events that can also support sellers.
General conclusions
Based on the analysis conducted, I conclude that the construction of a bearish wave set continues. Wave 2 or b has taken on a completed form, so in the near future, I expect the continuation of the construction of an impulsive downtrend wave 3 or c with a significant decline in the pair. An unsuccessful attempt to break the 1.1125 level, which corresponds to 23.6% Fibonacci, indicated the market's readiness for sales a month ago. I am currently only considering sales with targets around the calculated level of 1.0462, which corresponds to 127.2% Fibonacci.
On a larger wave scale, it can be seen that the presumed wave 2 or b, which is already more than 61.8% Fibonacci in length from the first wave, may be completed. If this is indeed the case, then the scenario with the construction of wave 3 or c and a decline in the pair below the 1.04 figure has begun to be implemented.
 English
 Русский
 Bahasa Indonesia
 Bahasa Malay
 ไทย
ไทย Español
 Deutsch
 Български
 Français
 Tiếng Việt
 中文
中文 বাংলা
বাংলা हिन्दी
 Čeština
 Українська
 Română


