Analysis of GBP/USD 5M

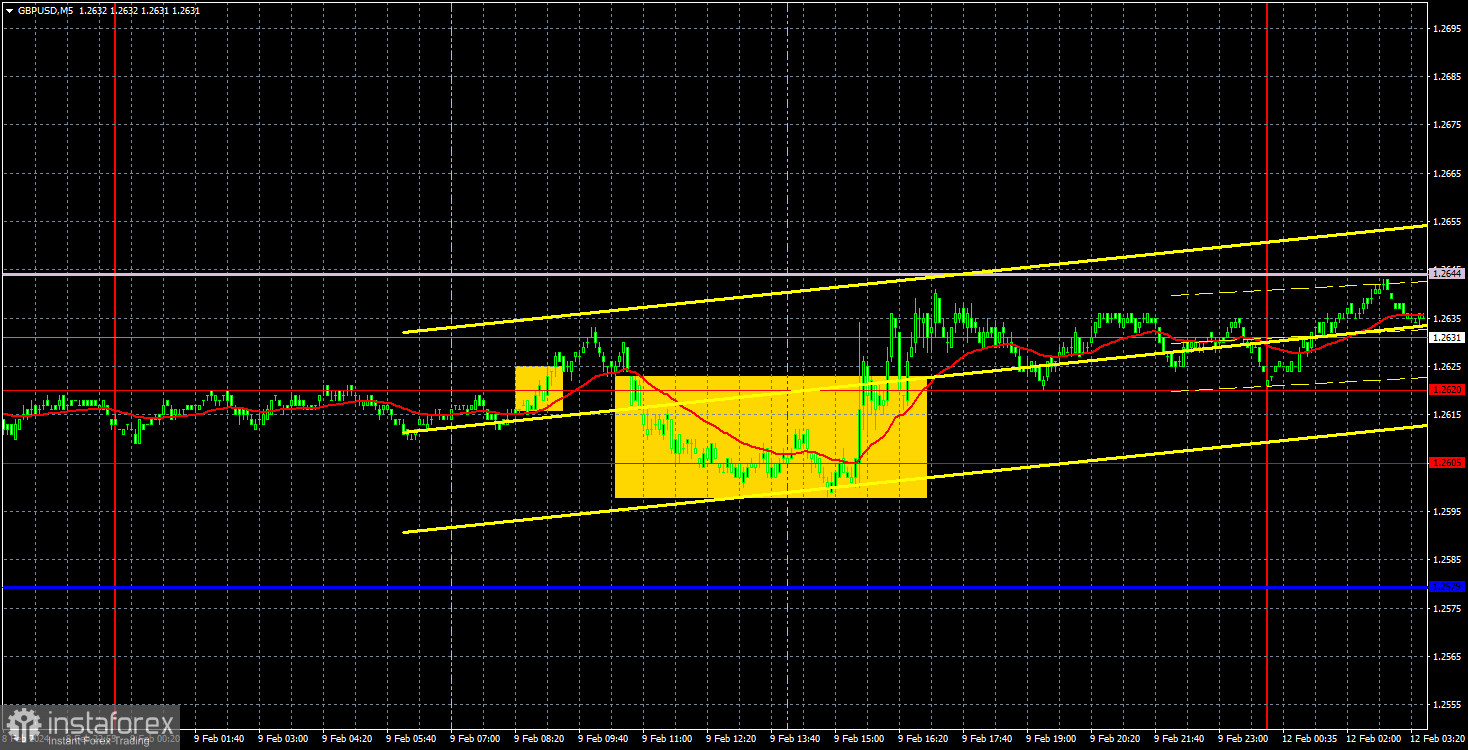
GBP/USD continued to exhibit mixed, low-volatility movements throughout Friday. The quotes once again interacted with the Senkou Span B line, which, to a greater extent, descended towards the price instead of the price rising towards it. Nevertheless, the British pound corrected by 50% against the preceding decline, and it finally left the sideways channel. Thus, the flat phase has ended, and we can expect a downward movement. The question is whether the market is ready for trends. And based on what we saw last week, it is quite difficult to say if the market is ready to start a trend.
However, this week, the price may bounce off the Senkou Span B and resume the downward movement. The challenge lies in the fact that this week's economic reports and the fundamental background may support the pound instead of the dollar. For instance, this week, we can look forward to Bank of England Governor Andrew Bailey's speech, inflation reports from the UK and the US, as well as a myriad of secondary reports and speeches. Considering that the market expects the UK inflation report to show an increase in value, we would assume that the pound will rise this week. However, this is just a forecast; inflation may also slow down, which can exert pressure on the pound.
On Friday, neither the UK nor the US witnessed any significant events. The pair spent the entire day around the 1.2605-1.2620 range, which served as the lower boundary of the sideways channel a week ago. Now the market simply ignores it and refuses to trade. Formally, two buy signals were generated around this area, but it made no sense to act on them as the Senkou Span B line was 24 pips higher.
COT report:
COT reports on the British pound showed a bullish bias. According to the latest report on the British pound, the non-commercial group opened 6,400 buy contracts and 6,100 short ones. As a result, the net position of non-commercial traders increased by 300 contracts in a week. The size of the net position implies that the number of long positions had not decreased, so the COT report does not suggest that the pound will finally start a pronounced decline. The fundamental background still does not provide grounds for long-term purchases of the British currency, but we can't confirm that this supports the downward movement.
The non-commercial group currently has a total of 83,900 buy contracts and 49,500 sell contracts. Since the COT reports do not provide an accurate forecast of the market's behavior at the moment, we need to pay close attention to the technical picture and economic reports. The technical analysis suggests that there's a possibility that the pound could show a pronounced downward movement, and for a long time now, the economic reports have also been significantly stronger in the United States than in the United Kingdom, but this has not benefited the dollar.
Analysis of GBP/USD 1H

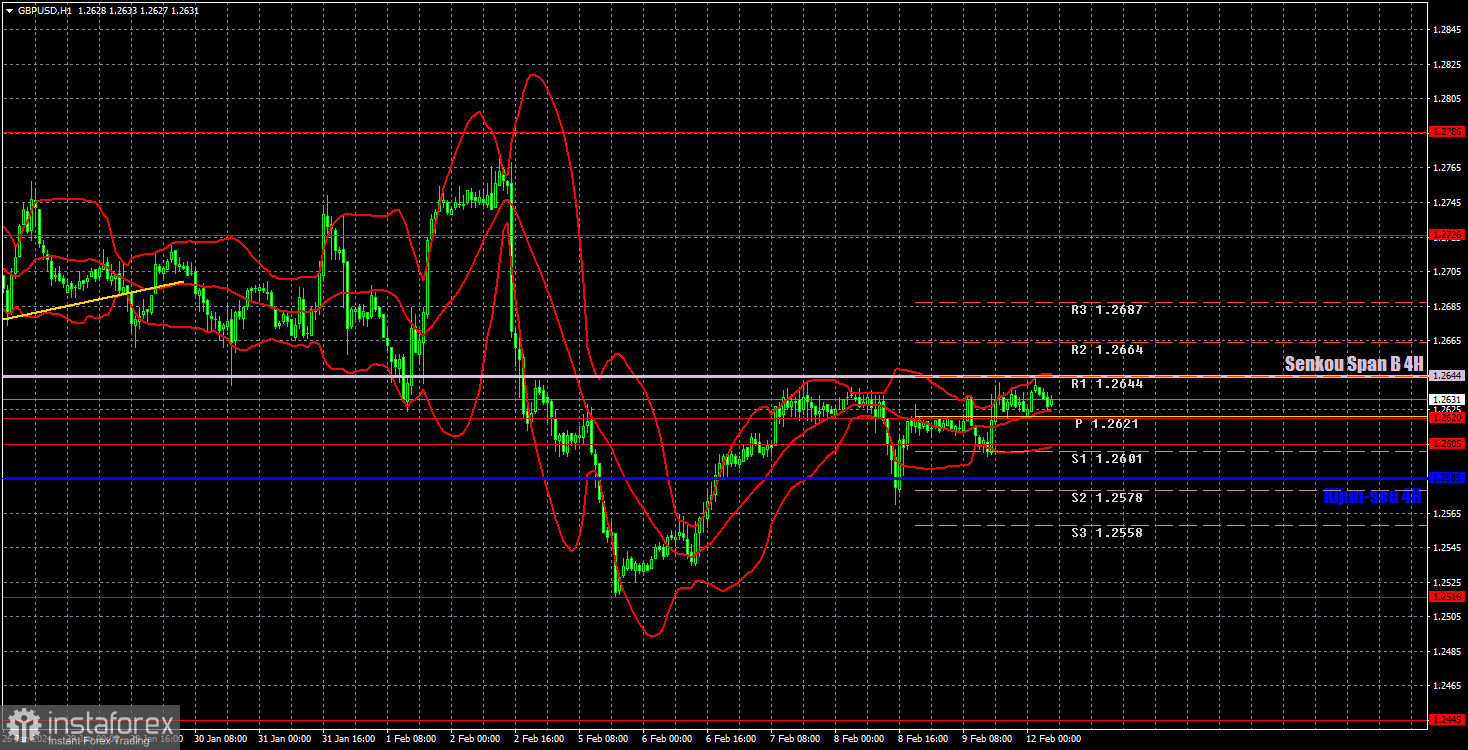
On the 1H chart, GBP/USD is no longer trading in the sideways channel and it may be on track to form a downtrend. However, recently, we've seen that the market is not in a rush to sell the pound. Hopefully, this is a temporary situation. This week, traders will have access to many reports, so we can expect stronger movements.
Since the last phase of growth (on the 24-hour timeframe) took several months, there is a possibility that the pound may continue to fall for several months. The targets of 1.18-1.20 seem realistic since the pound currently lacks fundamental and macroeconomic support. If the pair surpasses the Senkou Span B line, the pound may continue to rise with 1.2726 as the target level. If the pair consolidates below the critical line, we will consider shorts with 1.2516 as the target.
As of February 12, we highlight the following important levels: 1.2215, 1.2269, 1.2349, 1.2429-1.2445, 1.2516, 1.2605-1.2620, 1.2726, 1.2786, 1.2863, 1.2981-1.2987. The Senkou Span B (1.2644) and Kijun-sen (1.2585) lines can also serve as sources of signals. Don't forget to set a breakeven Stop Loss to breakeven if the price has moved in the intended direction by 20 pips. The Ichimoku indicator lines may move during the day, so this should be taken into account when determining trading signals.
On Monday, Bailey will speak. Since this will happen before the inflation report is published, we don't expect Bailey to share new information. Nevertheless, the market may grasp any hint of changes in monetary policy, so a reaction could follow.
Description of the chart:
Support and resistance levels are thick red lines near which the trend may end. They do not provide trading signals;
The Kijun-sen and Senkou Span B lines are the lines of the Ichimoku indicator, plotted to the 1H timeframe from the 4H one. They provide trading signals;
Extreme levels are thin red lines from which the price bounced earlier. They provide trading signals;
Yellow lines are trend lines, trend channels, and any other technical patterns;
Indicator 1 on the COT charts is the net position size for each category of traders;
Indicator 2 on the COT charts is the net position size for the Non-commercial group.
 English
 Русский
 Bahasa Indonesia
 Bahasa Malay
 ไทย
ไทย Español
 Deutsch
 Български
 Français
 Tiếng Việt
 中文
中文 বাংলা
বাংলা हिन्दी
 Čeština
 Українська
 Română

