Bitcoin

Higher Timeframes
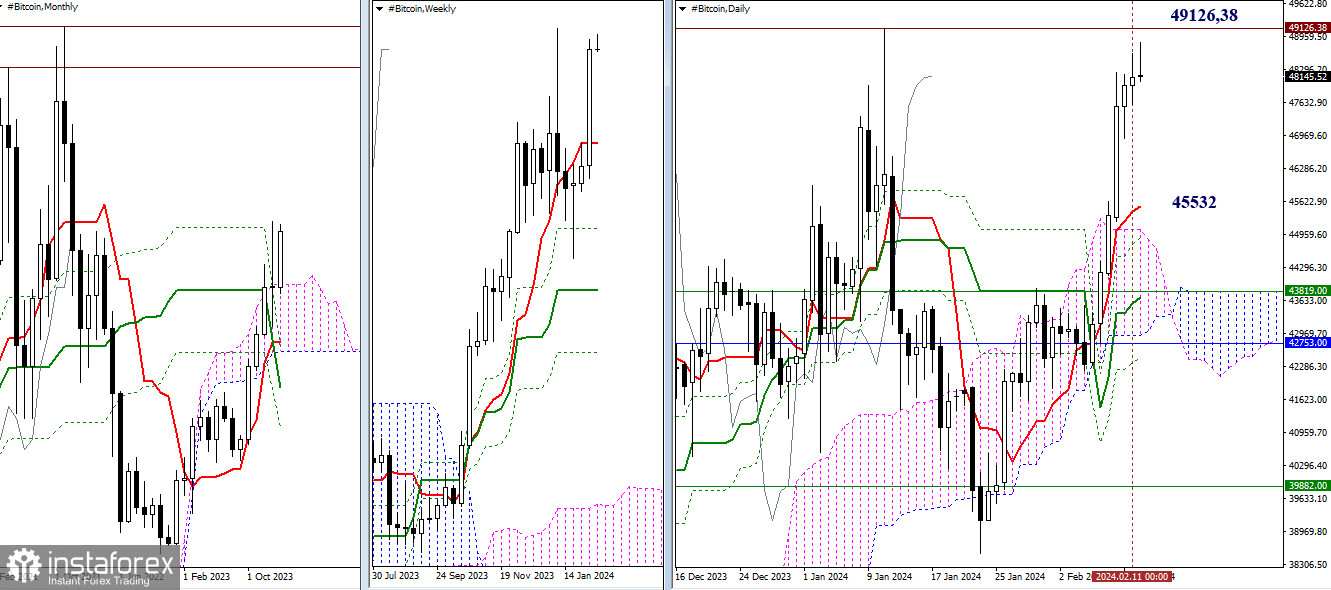
At the moment, Bitcoin is striving to update the January high (49,126.38). This update will open up new prospects for bullish players, with the next targets for upward movement being the 2021 highs of 64,768.80 and 68,959.73. In addition to the January high, the historical resistance of the monthly timeframe (48,529.59) is located in the current section of the chart.
The said resistance level is likely the reason for the failure last month, as bulls retreated after testing it. If they again fail to securely break through the zone of 48,529.59–49,126.38 in February, then in the development of a corrective decline, support may first come from the levels of the daily Ichimoku cloud, which are currently located at 45,532 – 45,064 – 44,899. Further support will come from the weekly short-term trend (43,819) and the upper boundary of the monthly Ichimoku cloud (42,753).

H4 – H1
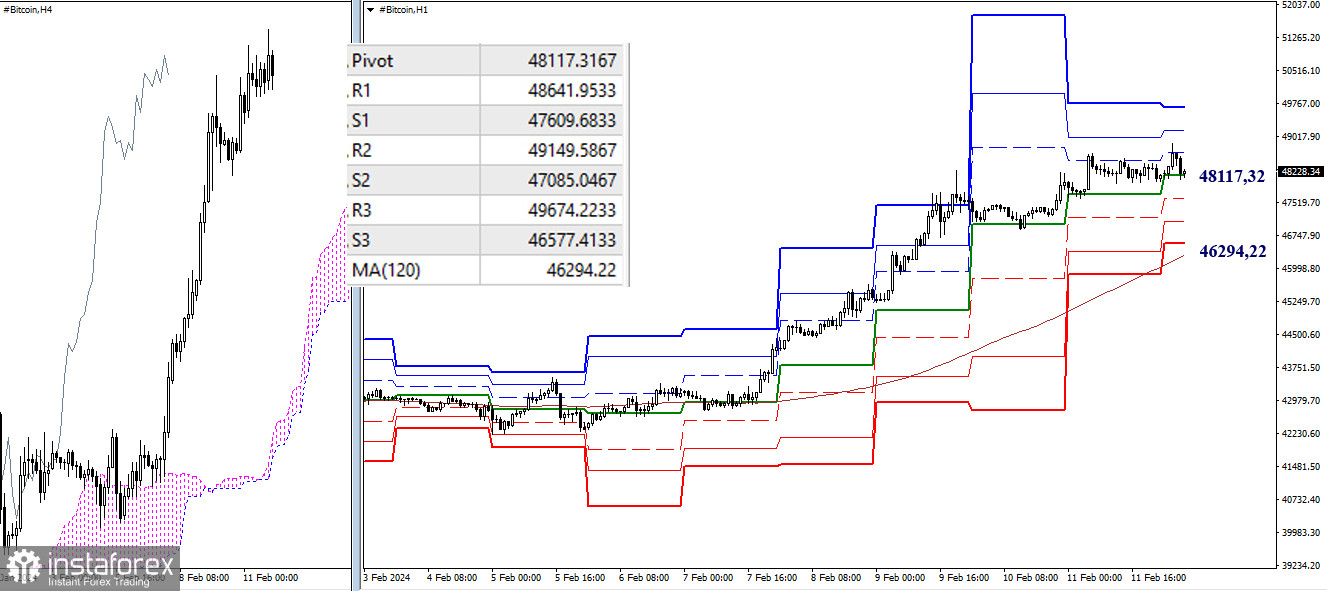
Bulls currently have the main advantage on the lower timeframes, developing an upward trend. The nearest targets for continuing the rise within the day are the resistances of classic pivot points (48,642 – 49,150 – 49,674). The key levels of the lower timeframes today act as supports, forming sufficient space for the development of a corrective decline. Thus, all the supports of classic pivot points (47,610 – 47,085 – 46,577) are located between the central pivot point of the day (48,117.32) and the weekly long-term trend (46,294.22). In the current conditions, they can serve as additional targets during a decline. A breakdown and reversal of the trend (46,577) will most likely lead to a change in the current balance of power in favor of further strengthening bearish sentiments.
***
The technical analysis of the situation uses:
Higher timeframes - Ichimoku Kinko Hyo (9.26.52) + Fibo Kijun levels
H1 - Pivot Points (classic) + Moving Average 120 (weekly long-term trend)
 English
 Русский
 Bahasa Indonesia
 Bahasa Malay
 ไทย
ไทย Español
 Deutsch
 Български
 Français
 Tiếng Việt
 中文
中文 বাংলা
বাংলা हिन्दी
 Čeština
 Українська
 Română

