EUR/USD

Higher Timeframes
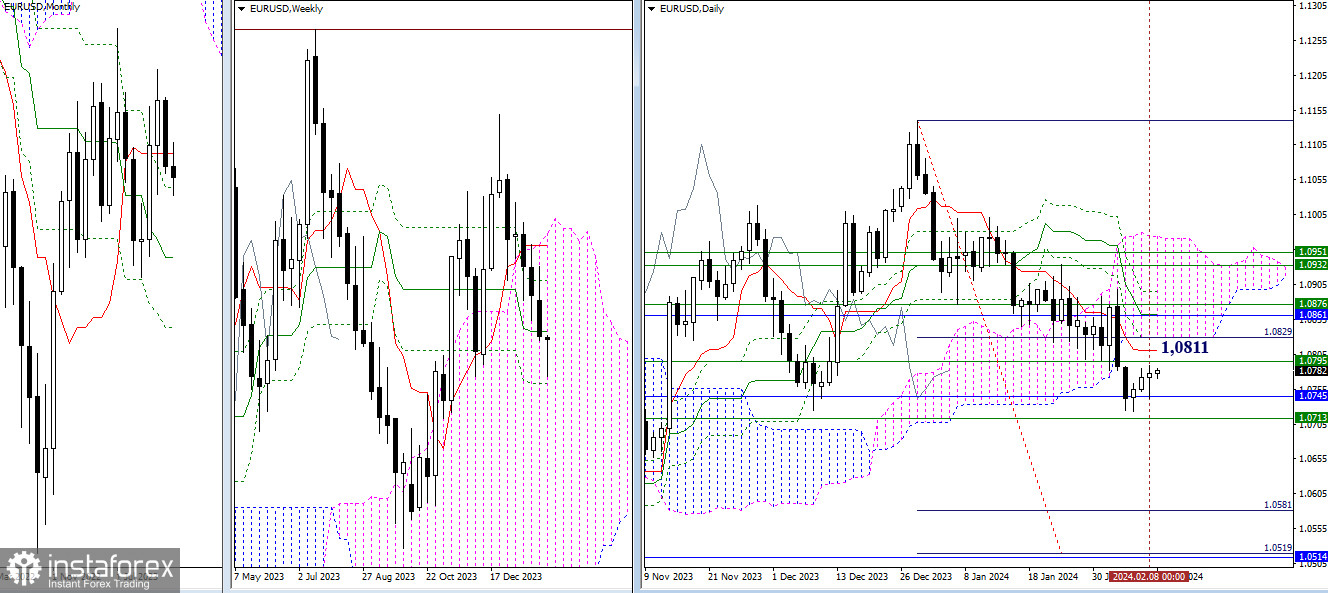
Bulls do not abandon hope for the implementation of a full-fledged daily correction, but at the moment, there is resistance from the weekly medium-term trend (1.0795) on the way to the daily short-term trend (1.0811). Today marks the end of the working week. The outcome of the weekly timeframe is crucial. A long lower shadow will instill optimism in the further plans of bulls. All previously mentioned target levels today maintain their positions.

H4 – H1
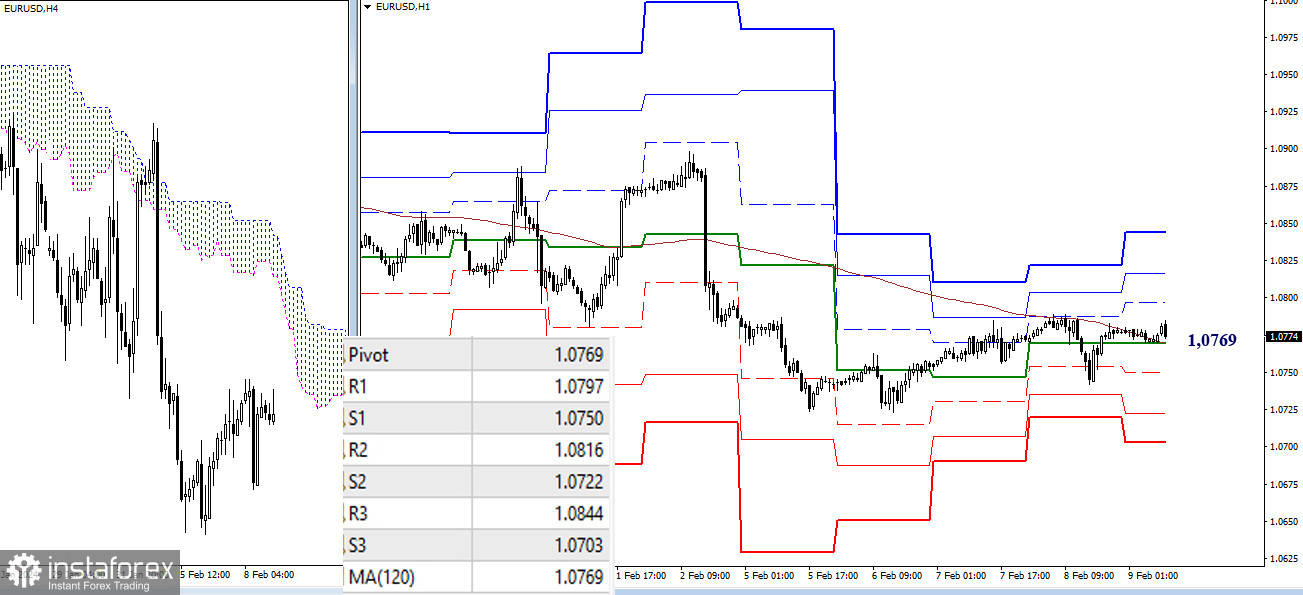
On the lower timeframes, there has been a prolonged struggle for possession of the daily long-term trend. The key levels of the lower timeframes have now united their efforts at the level of 1.0769 (weekly long-term trend + central pivot point of the day). Whoever possesses these key levels is more likely to develop a directional movement. Classic pivot points serve as benchmarks for the development of directional movement within the day. Today, they are located at 1.0797 – 1.0816 – 1.0844 (resistances) and at 1.0750 – 1.0722 – 1.0703 (supports).
***
GBP/USD

Higher Timeframes
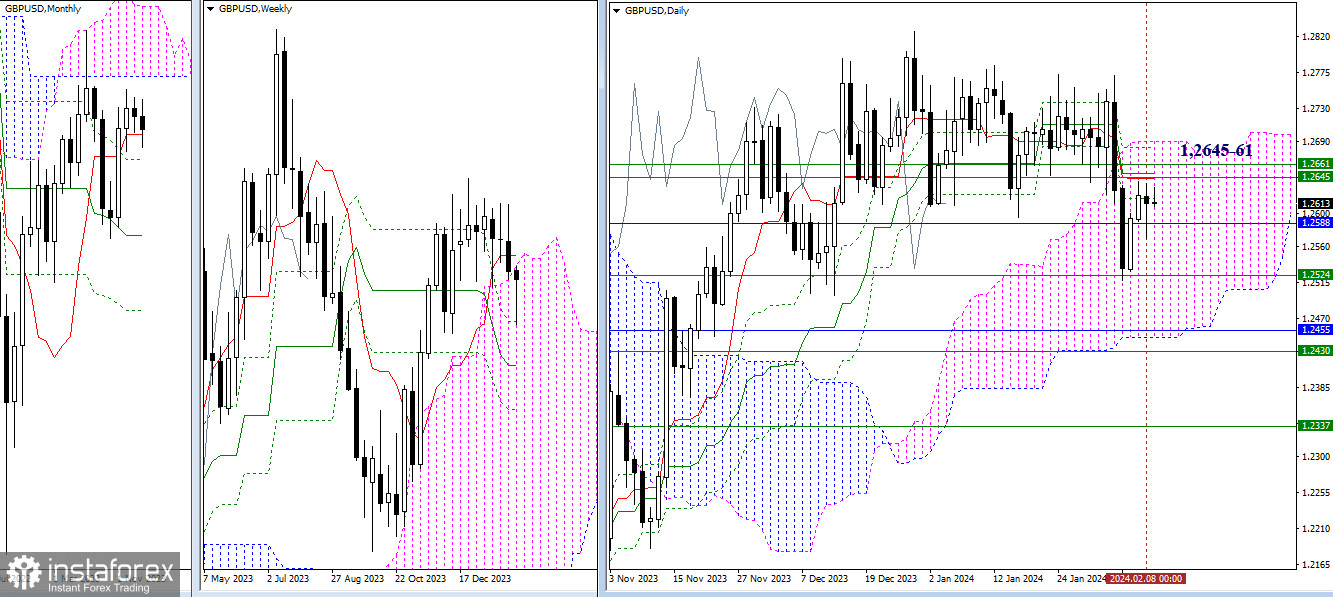
As the working week concludes, the pound encounters a cluster of resistances led by weekly levels (1.2645-61). The conclusions and expectations presented earlier retain their significance today. Breaking through the nearest resistances is crucial, as well as entering the bullish zone relative to the daily cloud (1.2690). In case of bearish activity, supports at 1.2588 (monthly short-term trend) and 1.2524 (weekly Fibonacci Kijun) may be of importance.

H4 – H1
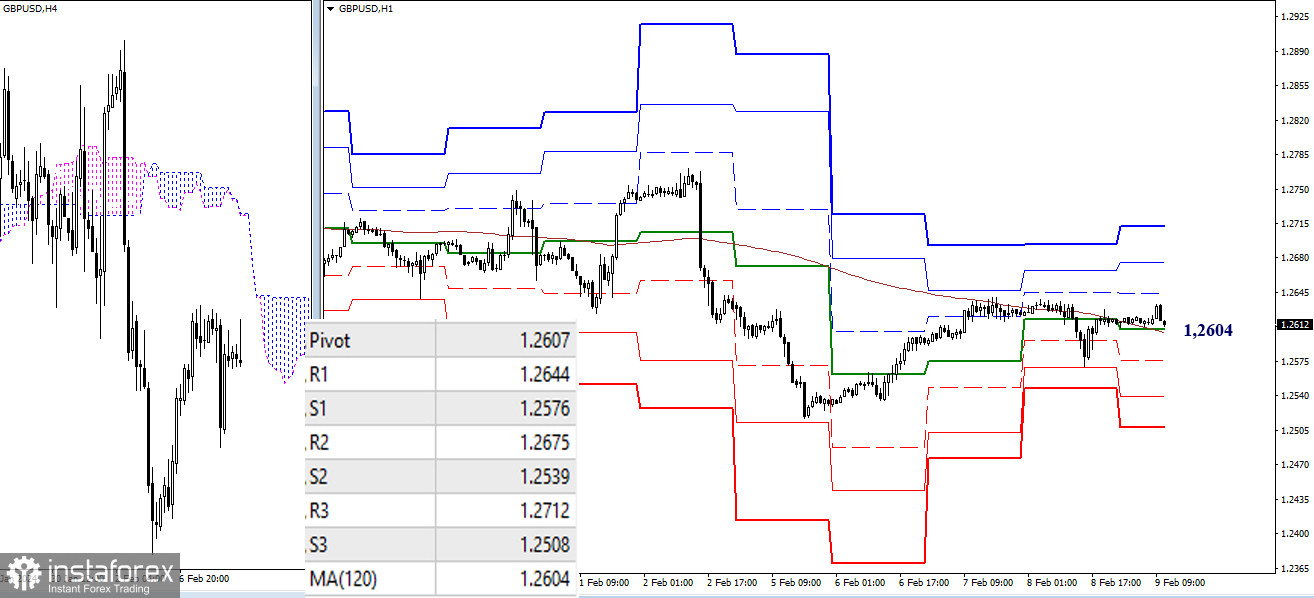
On the lower timeframes, there is a struggle for key levels that determine the current balance of power. Trading above these levels will contribute to the strengthening of bullish sentiments, with intraday targets being the resistances of classic pivot points (1.2644 – 1.2675 – 1.2712). Trading below will give the main advantage to bearish players, with targets at the supports of classic pivot points (1.2576 – 1.2539 – 1.2508).
***
The technical analysis of the situation uses:
Higher timeframes - Ichimoku Kinko Hyo (9.26.52) + Fibonacci Kijun levels
Lower timeframes - H1 - Pivot Points (classic) + Moving Average 120 (weekly long-term trend)
 English
 Русский
 Bahasa Indonesia
 Bahasa Malay
 ไทย
ไทย Español
 Deutsch
 Български
 Français
 Tiếng Việt
 中文
中文 বাংলা
বাংলা हिन्दी
 Čeština
 Українська
 Română

