EUR/USD

Higher Timeframes
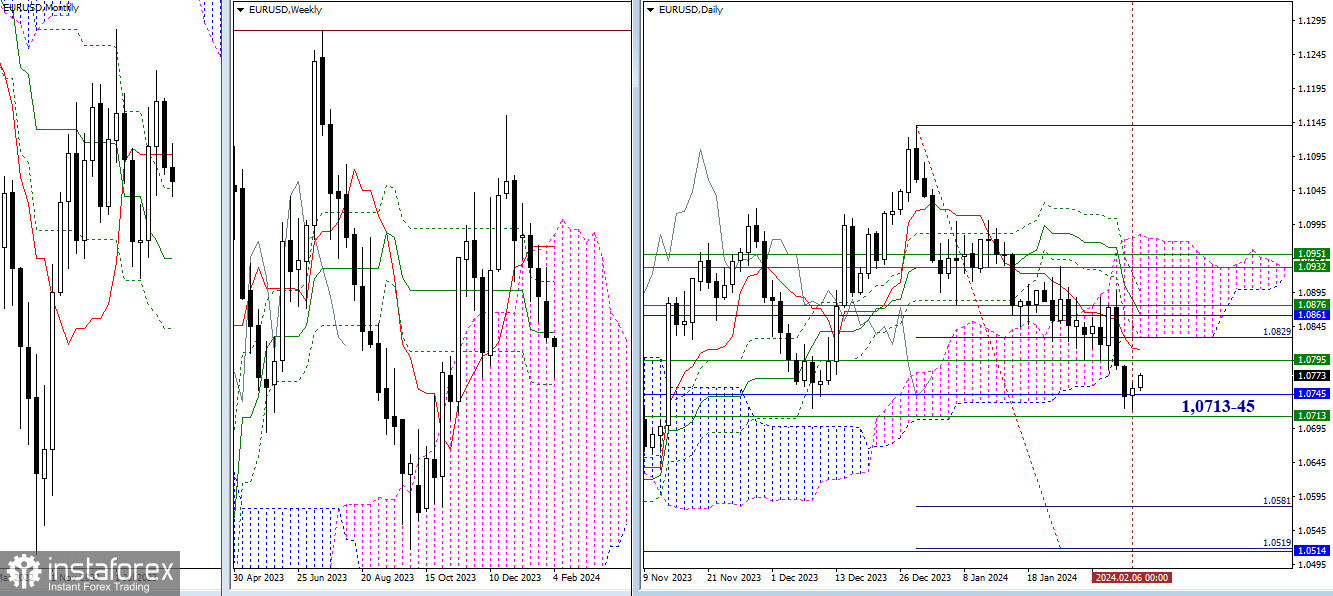
The euro moved beyond the daily cloud and formed a new bearish target (1.0519-81). The target is currently reinforced by the monthly medium-term trend (1.0515). To redirect bearish attention to these benchmarks, the market must first break through the encountered supports around 1.0713 (final level of the weekly Ichimoku cross) and 1.0745 (monthly Fibonacci Kijun). A rebound from the supports and a retest of the levels passed (1.0795 - 1.0811 - 1.0829) could return the situation to the daily cloud (1.0829).

H4 – H1
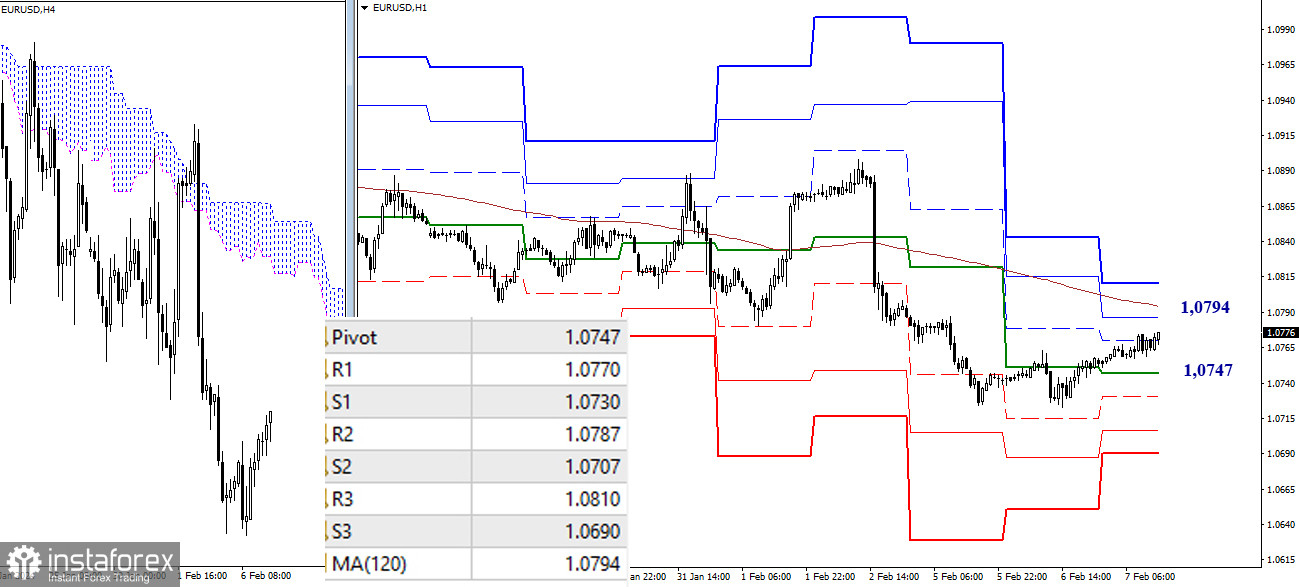
Meeting with the supports of higher timeframes led to the development of a corrective rise on lower timeframes. In the end, buyers managed to consolidate above the central pivot point of the day (1.0747). Currently, they continue the ascent, with the main target being the weekly long-term trend (1.0794). A breakout and reliable consolidation above the trend could significantly strengthen the bullish players. In this case, the classic pivot point R3 (1.0810) will be the target. If the market changes priorities and bears return to active decline, the pair awaits support from the classic pivot points (1.0747 - 1.0730 - 1.0707 - 1.0690) as intraday targets.
***
GBP/USD

Higher Timeframes
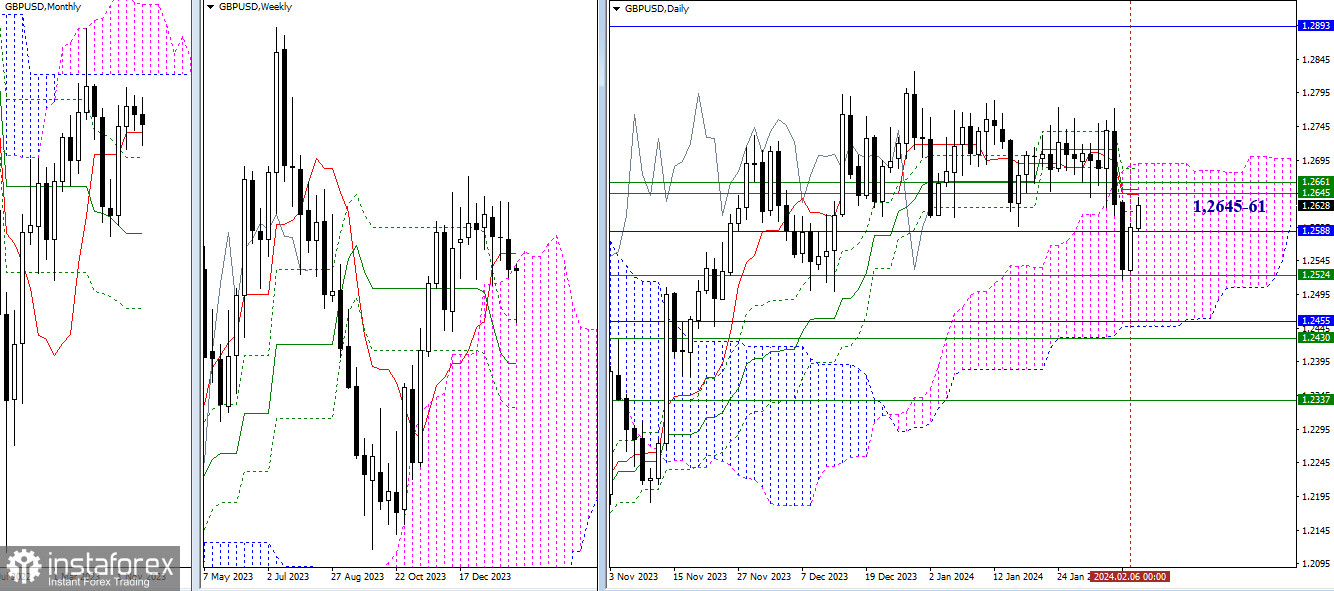
On Tuesday, bearish players tested the weekly Fibonacci Kijun (1.2524), but they failed to maintain their advantages. The opponent used the strength of support and began to recover positions. Currently, bullish players face an accumulation of daily and weekly levels around 1.2645-61. Passing through this accumulation, as well as subsequent elimination of the death cross of the daily Ichimoku cloud (1.2682) and entering the bullish zone relative to the daily cloud (1.2690), will allow bullish players to restore the upward trend and move towards the monthly cloud (1.2893). In case of a return to decline, the nearest support may come from the monthly short-term trend (1.2588) and the weekly Fibonacci Kijun (1.2524).

H4 – H1
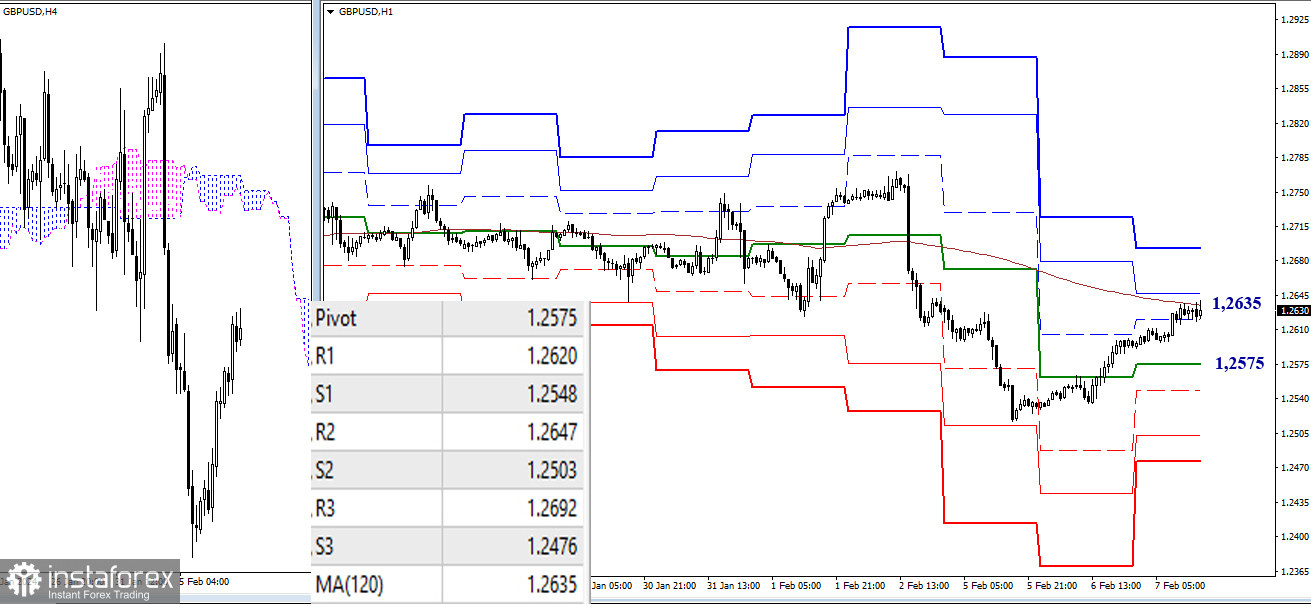
On lower timeframes, the weekly long-term trend (1.2635) is currently being tested for strength. This level is key and determines the current balance of power. A breakout, consolidation above, and a reversal of the moving average would prefer the development and strengthening of bullish sentiments. Intraday targets will be the resistances of classic pivot points located at 1.2647 (R2) and 1.2692 (R3). Inability to overcome the weekly long-term trend (1.2635) may bring bearish players back to the market. In this case, the targets for a decline will be the central pivot point of the day (1.2575) and the supports of classic pivot points (1.2548 - 1.2503 - 1.2476).
***
The technical analysis of the situation uses:
Higher timeframes - Ichimoku Kinko Hyo (9.26.52) + Fibonacci Kijun levels
Lower timeframes - H1 - Pivot Points (classic) + Moving Average 120 (weekly long-term trend)
 English
 Русский
 Bahasa Indonesia
 Bahasa Malay
 ไทย
ไทย Español
 Deutsch
 Български
 Français
 Tiếng Việt
 中文
中文 বাংলা
বাংলা हिन्दी
 Čeština
 Українська
 Română

