After the January meeting, the Bank of Japan kept the parameters of its credit and monetary policy unchanged. Immediately after the announcement of the Bank of Japan's decision, the yen weakened moderately but quite sharply, and the USD/JPY pair jumped to an intraday high of 148.55. However, after the statements from Bank of Japan Governor Kazuo Ueda, the pair shifted to a decline.
At the beginning of this week, including against the backdrop of weak macro data from Japan, the yen came under pressure again, and the USD/JPY pair reached a new high since December 2023, above the 148.80 mark.

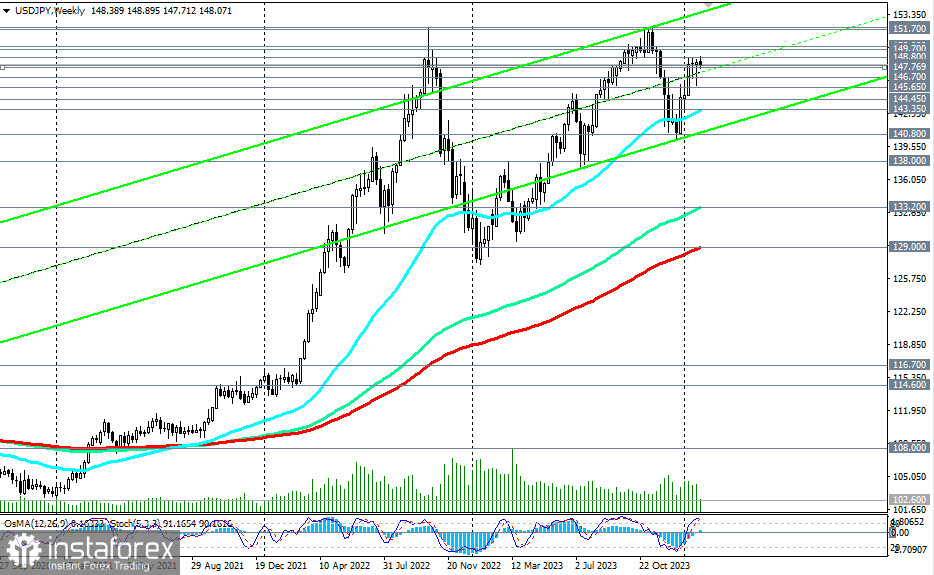
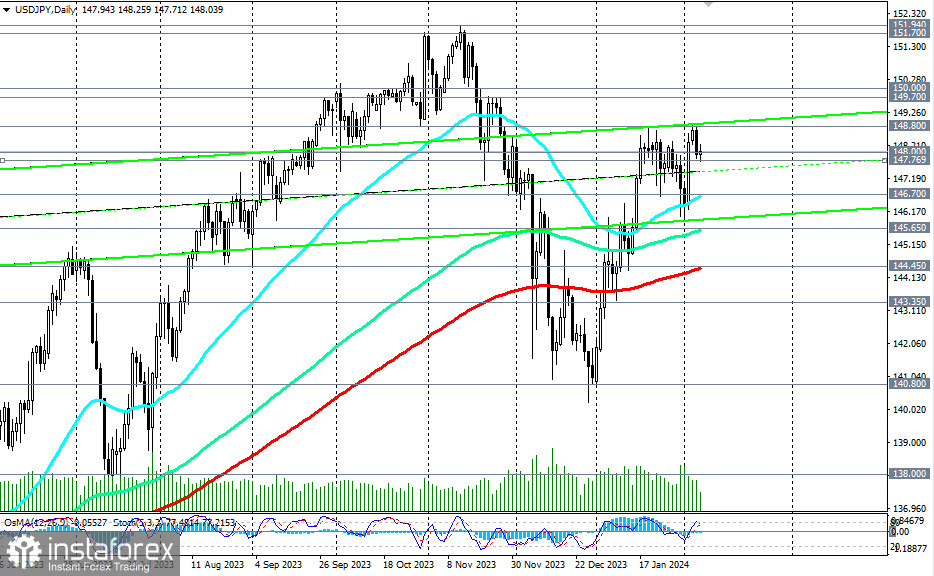
From a technical point of view, USD/JPY continues to trade in a bullish market zone, medium-term—above the key support level of 144.45 (200 EMA on the daily chart), and long-term—above the key support level of 129.00 (200 EMA on the weekly chart).
Thus, long positions remain preferable both from a technical and fundamental point of view.
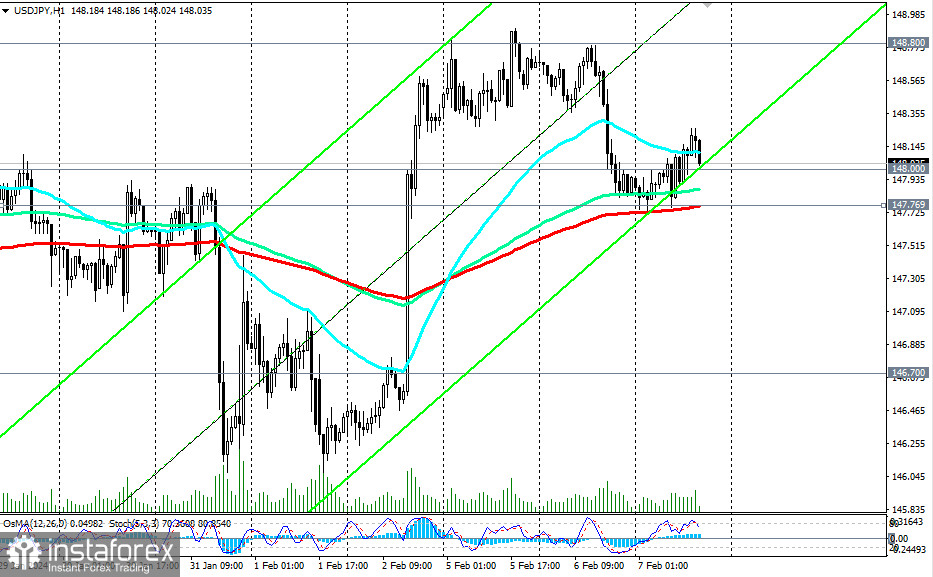
Breaking Wednesday's high of 148.25 is likely to be the first signal to resume long positions, and a break above the 148.80 level would confirm this.

In an alternative scenario, breaking the important short-term support level of 147.77 (200 EMA on the 1-hour chart) may be the first signal to open short positions with correction targets at support levels of 146.70 (50 EMA on the daily chart), 145.65 (144 EMA on the daily chart).
Further decline and breaking the key support level of 144.45 will return USD/JPY to the medium-term bearish market zone, also reviving interest in short positions with the prospect of a decline to the zone of long-term support levels 133.20 (144 EMA on the weekly chart), 129.00 (200 EMA on the weekly chart), with intermediate targets at local support levels 140.80, 138.00.
Support levels: 147.77, 147.00, 146.70, 146.00, 145.65, 144.45, 143.35, 140.80, 138.00, 133.20, 129.00
Resistance levels: 148.00, 148.25, 148.80, 149.00, 149.70, 150.00, 151.00, 151.70, 151.95, 152.00, 153.00
Trading Scenarios
Main Scenario
Aggressively: Buy at the market. Stop Loss 147.55
Moderately: Buy Stop 148.35. Stop Loss 147.55
Targets 148.80, 149.00, 149.70, 150.00, 151.00, 151.70, 151.95, 152.00, 153.00
Alternative Scenario
Aggressively: Sell Stop 147.70. Stop Loss 148.35
Moderately: Sell Stop 147.50. Stop Loss 148.35
Targets 147.00, 146.70, 146.00, 145.65, 144.45, 143.35, 140.80, 138.00, 133.20, 129.00
'Targets' correspond to support/resistance levels. This also does not mean that they will necessarily be reached, but can serve as a reference when planning and placing trading positions.
 English
 Русский
 Bahasa Indonesia
 Bahasa Malay
 ไทย
ไทย Español
 Deutsch
 Български
 Français
 Tiếng Việt
 中文
中文 বাংলা
বাংলা हिन्दी
 Čeština
 Українська
 Română

