Analysis of EUR/USD 5M

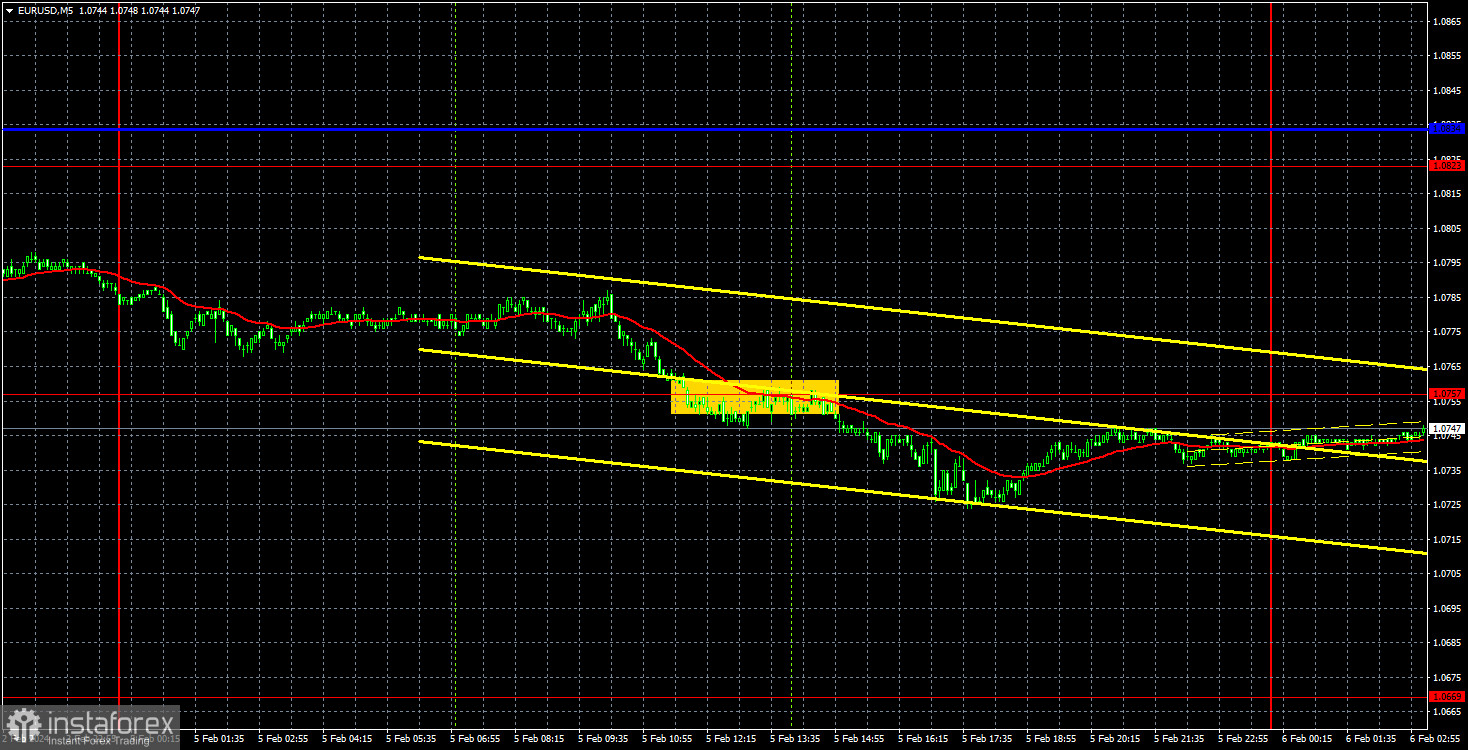
EUR/USD continued to trade lower on Monday. The decline was not as strong as what we witnessed on Friday since the Monday's fundamental/macroeconomic background was weaker. However, Federal Reserve Chief Jerome Powell spoke again and confirmed that the central bank is unlikely to cut rates as soon as March, and that there's a 95% probability the interest rate will not be lowered. Naturally, this information lifted the dollar. Also, the US ISM Non-Manufacturing PMI was published, significantly exceeding the forecast values. So this report supported the dollar as well. Last week, the majority of events and reports turned out in favor of the US currency.
Therefore, it is not surprising that the pair continues to fall, as the macroeconomic and fundamental background supports it. It is even less surprising if we consider the technical picture, which also supports the US dollar. We believe that in the medium term, the euro may continue to fall until it reaches price parity. There will be few significant events this week, and the euro is not obliged to fall every day. Nevertheless, the downtrend may persist.
As for trading signals, EUR/USD only generated one signal on Monday. At the beginning of the US session, the price surpassed the level of 1.0757, afterwards it fell by 30 pips. However, you could stay in short positions even after the pair surpasses the level of 1.0823. Right now the pair is falling without any retracements. If today the price stays below the level of 1.0757, you can stay in shorts with 1.0669 as the target.
COT report:
The latest COT report is dated January 23. As seen in the charts above, it is clear that the net position of non-commercial traders has been bullish for quite some time. To put it simply, the number of long positions is much higher than the number of short positions. This should support the euro, but we still do not see fundamental factors for the euro to strengthen further. In recent months, both the euro and the net position have been rising. However, over the past few weeks, big players have started to reduce their long positions, and we believe that this process will continue.
We have previously pointed out that the red and green lines have moved apart from each other, which often precedes the end of a trend. At the moment, these lines are still far apart. Therefore, we support the scenario in which the euro should fall and the uptrend must end. During the last reporting week, the number of long positions for the non-commercial group decreased by 9,100, while the number of short positions increased by 6,600. Accordingly, the net position fell by 15,700. The number of buy contracts is still higher than the number of sell contracts among non-commercial traders by 89,000 (it was 104,000). The gap is quite large, and even without COT reports, it is clear that the euro should continue to fall.
Analysis of EUR/USD 1H

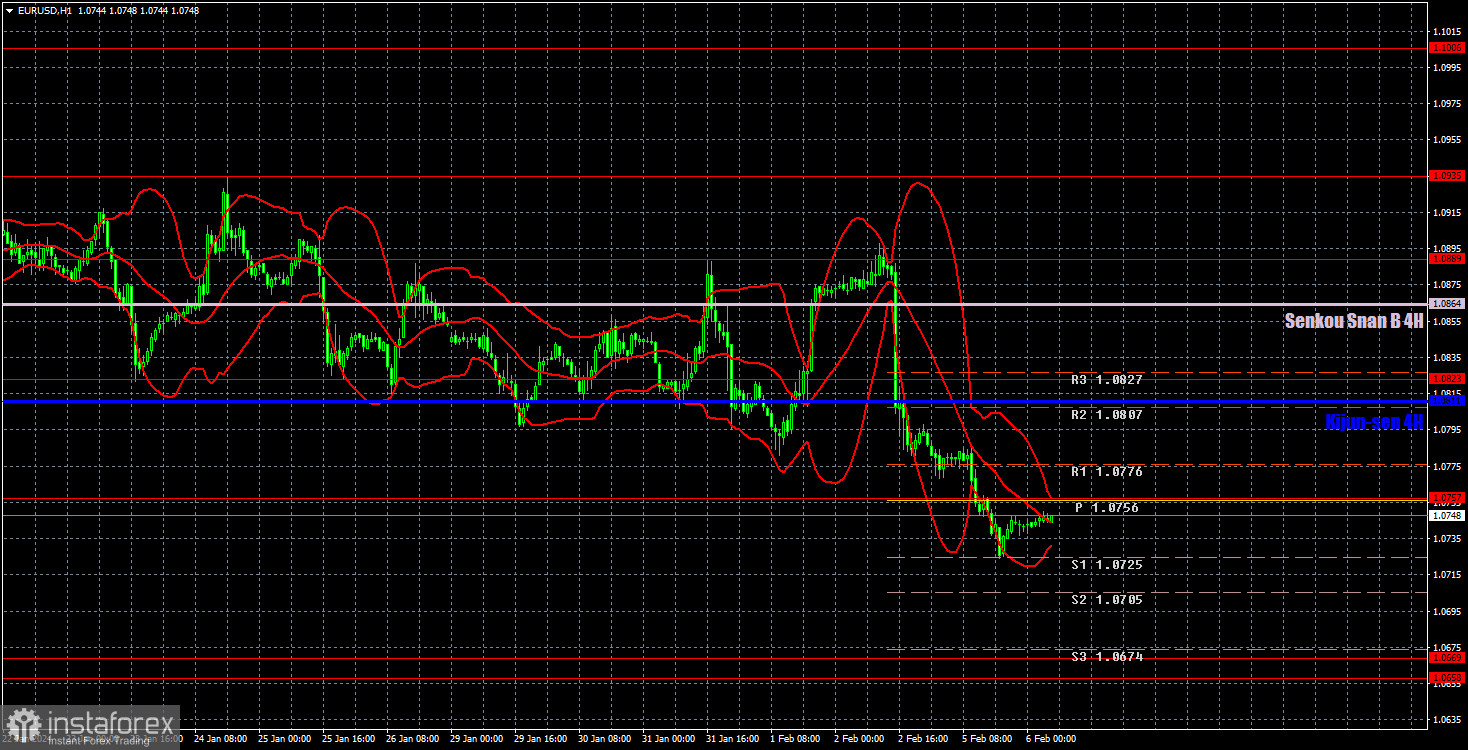
On the 1-hour chart, EUR/USD continues to exhibit a downward movement, which was triggered by last week's events. Since the US economy is still strong and rarely disappoints, the euro may continue to fall further, which is what we are expecting. In our opinion, nearly all the current factors indicate that the dollar will strengthen.
On February 6, we highlight the following levels for trading: 1.0581, 1.0658-1.0669, 1.0757, 1.0823, 1,0889, 1.0935, 1.1006, 1.1092, 1.1137, 1.1185, as well as the Senkou Span B (1.0894) and Kijun-sen (1.0834) lines. The Ichimoku indicator lines can move during the day, so this should be taken into account when identifying trading signals. Don't forget to set a breakeven Stop Loss if the price has moved in the intended direction by 15 pips. This will protect you against potential losses if the signal turns out to be false.
On Tuesday, the release of December's eurozone retail sales data is anticipated, although objectively, traders may consider it insignificant. No other important events are planned for today. The downtrend persists, so we can expect the euro to start a new decline.
Description of the chart:
Support and resistance levels are thick red lines near which the trend may end. They do not provide trading signals;
The Kijun-sen and Senkou Span B lines are the lines of the Ichimoku indicator, plotted to the 1H timeframe from the 4H one. They provide trading signals;
Extreme levels are thin red lines from which the price bounced earlier. They provide trading signals;
Yellow lines are trend lines, trend channels, and any other technical patterns;
Indicator 1 on the COT charts is the net position size for each category of traders;
Indicator 2 on the COT charts is the net position size for the Non-commercial group.
 English
 Русский
 Bahasa Indonesia
 Bahasa Malay
 ไทย
ไทย Español
 Deutsch
 Български
 Français
 Tiếng Việt
 中文
中文 বাংলা
বাংলা हिन्दी
 Čeština
 Українська
 Română

