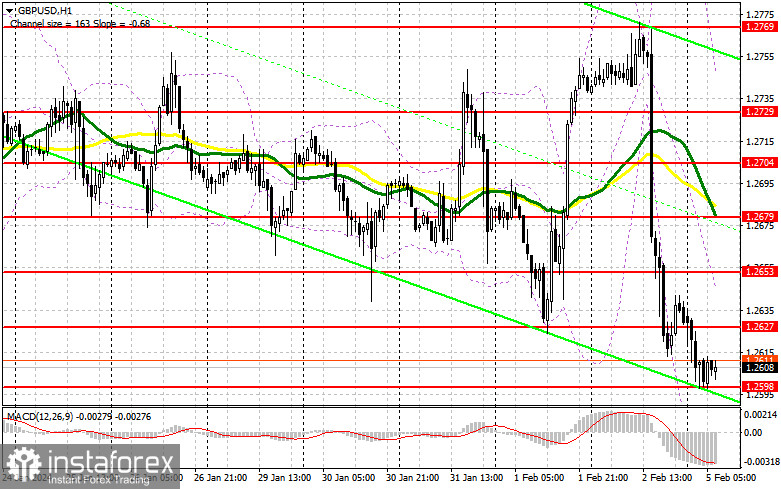
Last Friday, GBP/USD generated several signals to enter the market. Now let's look at the 5-minute chart and try to figure out what actually happened. In my previous forecast, I indicated the level of 1.2771 and planned to make decisions on entering the market from there. A rise and a false breakout at 1.2771 generated a sell signal, but a major downward movement only took place after the US labor market data. Buying on a rebound from 1.2653 did not bring much success. After the pair grew by 15 pips, the pair was under pressure again to continue the new trend.

For long positions on GBP/USD:
Last Friday, the speech of Bank of England MPC member Huw Pill did not particularly help the British pound, as the market was focused on the US reports, which surpassed economists' expectations and became the main reason why the pound fell and brought the pair back to the area of the annual low. Today, only very good data on economic activity can save the bulls, which is quite possible. Strong UK Services PMI data will automatically pull up the composite PMI index, which could lead to a spike in the pair's upward movement in the first half of the day.
In case of weak figures and the pair is under pressure again, it would be better to be cautious. Forming a false breakout near the monthly low of 1.2598 will provide an entry point for long positions in hopes that the pair recovers, with the potential to test 1.2627. A breakout and consolidation above this range will strengthen the demand for the pound and open the way to 1.2653, which in itself is quite a strong correction. The farthest target will be the 1.2679 high, where I will take profits. This is in line with the bearish moving averages. In a scenario where GBP/USD falls and there are no bulls at 1.2598, we might see a new sell-off in the first half of the day, which will support the downtrend. A false breakout near the next support at 1.2580 will confirm the correct entry point. You can open long positions on GBP/USD immediately on a rebound from the low of 1.2558, bearing in mind an intraday correction of 30-35 pips.
For short positions on GBP/USD:
Sellers are in control of the market and are one step away from updating the yearly low. Today, the bears may continue to exert pressure. In case the pound recovers in the first half of the day after good PMI data, I plan to act after a false breakout near the nearest resistance at 1.2627. This would confirm the presence of big players in the market, creating a sell signal with the downward target at 1.2598 - the yearly low. A breakout and an upward retest of this range will deal a serious blow to the bulls' positions, leading to the removal of stop orders and open the way to 1.2580, where I expect big buyers to emerge. A lower target will be the area of 1.2558, where I will take profits. If GBP/USD grows and there are no bears at 1.2627, the bulls will regain the initiative in hopes of at least some correction. In such a case, I would delay short positions until a false breakout at 1.2653. If there is no downward movement there, I will sell GBP/USD immediately on a bounce right from 1.2679, considering a downward correction of 30-35 pips within the day.

COT report:
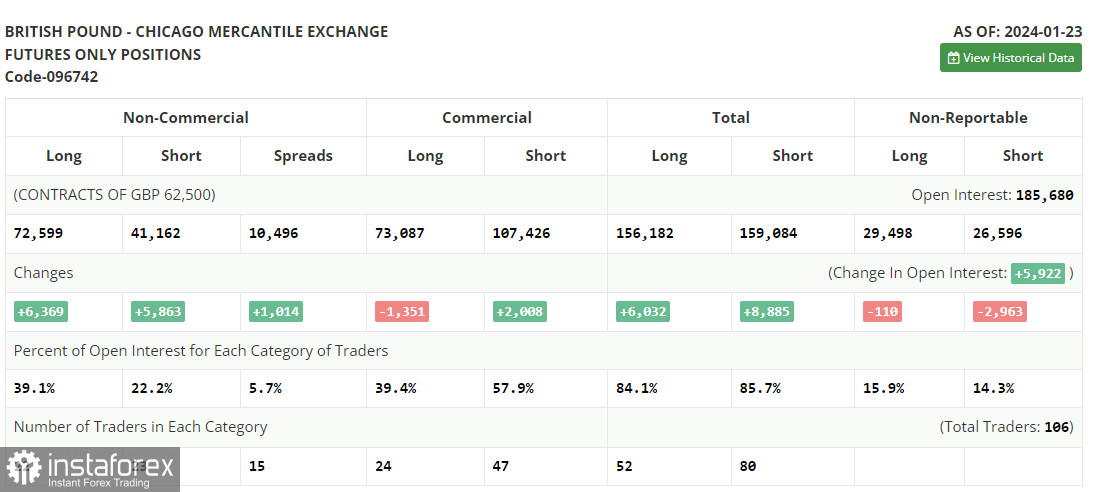
In the COT report (Commitment of Traders) for January 23, we find an increase in both long and short positions. Considering that traders are in a state of confusion, much like the Bank of England, the pound continues to receive support from buyers of risk assets. It is clear that the central bank is unlikely to opt for an imminent interest rate cut, especially after recent news about the resurgence of inflation pressures. The two key central bank meetings will help determine the pound's direction – the Federal Reserve meeting and the Bank of England meeting. A firm stance may negatively impact the demand for risk assets, including the British pound; however, we shouldn't expect a significant decline from the pound. The latest COT report said that long non-commercial positions rose by 6,369 to 72,599, while short non-commercial positions increased by 5,863 to 41,162. As a result, the spread between long and short positions increased by 1,014.

Indicator signals:
Moving Averages
The instrument is trading below the 30 and 50-day moving averages. It indicates that GBP/USD is likely to decline lower.
Please note that the time period and levels of the moving averages are analyzed only for the H1 chart, which differs from the general definition of the classic daily moving averages on the D1 chart.
Bollinger Bands
If GBP/USD falls, the indicator's lower boundary near 1.2558 will serve as support.
Description of indicators:
• A moving average of a 50-day period determines the current trend by smoothing volatility and noise; marked in yellow on the chart;
• A moving average of a 30-day period determines the current trend by smoothing volatility and noise; marked in green on the chart;
• MACD Indicator (Moving Average Convergence/Divergence) Fast EMA with a 12-day period; Slow EMA with a 26-day period. SMA with a 9-day period;
• Bollinger Bands: 20-day period;
• Non-commercial traders are speculators such as individual traders, hedge funds, and large institutions who use the futures market for speculative purposes and meet certain requirements;
• Long non-commercial positions represent the total number of long positions opened by non-commercial traders;
• Short non-commercial positions represent the total number of short positions opened by non-commercial traders;
• The non-commercial net position is the difference between short and long positions of non-commercial traders.
 English
 Русский
 Bahasa Indonesia
 Bahasa Malay
 ไทย
ไทย Español
 Deutsch
 Български
 Français
 Tiếng Việt
 中文
中文 বাংলা
বাংলা हिन्दी
 Čeština
 Українська
 Română

