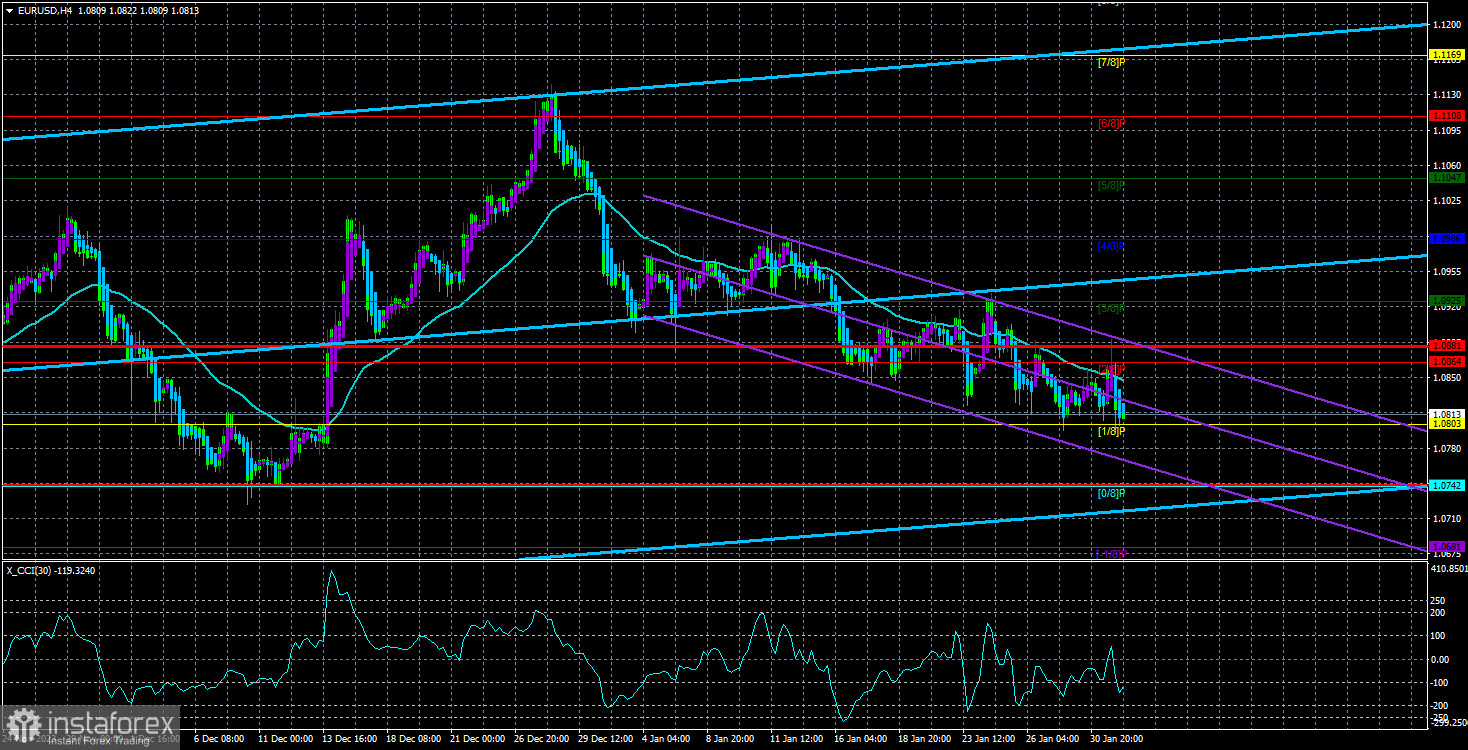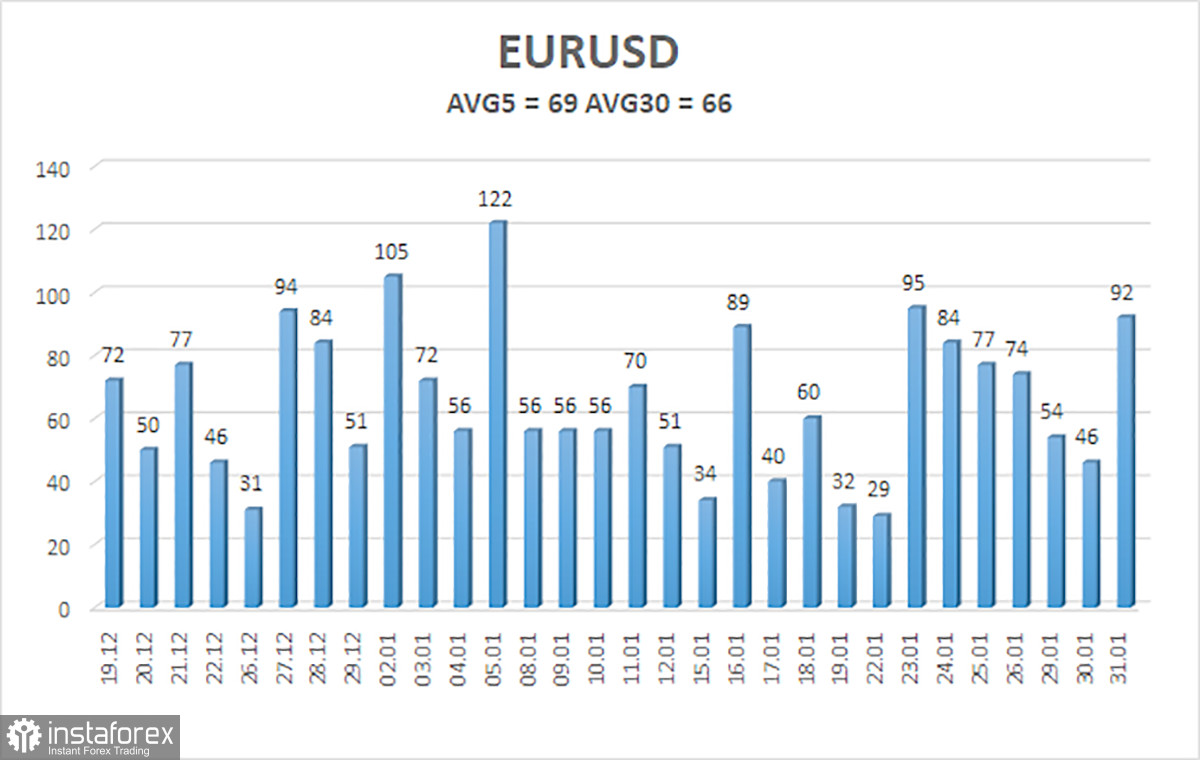
On Wednesday, the EUR/USD currency pair showed the same weak, sideways, or downward movement. We have already mentioned that the downward trend persists, but the price often corrects and bounces back up. This is happening amid relatively low volatility, as vividly illustrated below. Therefore, the movements of the pair still leave much to be desired.
In this article, we will not consider the results of the Fed meeting. After the finalization moment and Jerome Powell's speech, at least a day should pass for market emotions to settle down and for a sober assessment of the information received.
Yesterday, the market received a new batch of data on the state of the European economy, this time from Germany. It became known that retail sales volumes in December decreased by 1.6% instead of the expected +0.7%. The unemployment rate remained at 5.8%. The number of new unemployment benefit claims decreased by 2,000 against the forecast of +11,000. And the inflation rate dropped to 2.9% y/y against forecasts of 3.0-3.2%. Four reports in total; let's try to understand their significance for the European currency.
It's worth noting that the unemployment rate did not change, and unemployment benefit claims had a minimal deviation from the forecast. Therefore, these reports are unlikely to be considered positive or negative for the euro. However, retail sales again fell in volume, and inflation decreased more than expected. Recall that the faster inflation falls, the fewer reasons the ECB has to keep the rate at its peak.
Currently, debates continue about when the cycle of monetary policy easing will begin, and the lower the inflation, the sooner it will start, which is a bearish factor for the European currency. At least two out of four reports were not in favor of the euro, and the other two were neutral.
However, Luis de Guindos added fuel to the fire, speaking for the second time this week. He noted that the growth of the European economy in 2024 may be lower than previously forecasted, as economic prospects have deteriorated since December. He also pointed out that inflation has been pleasing lately and may reach the target mark earlier than expected. So, inflation is falling faster than expected, and the economy is declining more than expected. Both factors, again, are not in favor of the European currency.
Regardless of the Fed's decision, the European currency should continue to decline against the dollar. Tomorrow, we will summarize the meetings of the Fed and the Bank of England, and by then, the technical picture will change, and the fundamental background will make us look at it in a completely new way. But for now, it's too early to conclude.
On the 24-hour TF, the EUR/USD pair has almost reached the Senkou Span B line of the Ichimoku cloud. Overcoming this line will significantly increase the probability of further depreciation of the European currency. Recall that the CCI indicator on the 4-hour TF has entered the overbought zone four times, and each time, it ended only with a relatively small downward correction. We expect a much stronger decline for the pair.
We remind you that no unequivocal conclusions can be drawn about the ECB and Fed rates in 2024. It needs to be clarified how many times a particular central bank will cut rates and when the cycle of monetary policy easing will begin.

The average volatility of the euro/dollar currency pair for the last five trading days as of February 1st is 69 points and is characterized as "average." Thus, we expect the pair to move between the levels of 1.0743 and 1.0881 on Thursday. A reversal of the Heiken Ashi indicator upwards will indicate a new stage of corrective movement.
Nearest support levels:
S1 – 1.0803
S2 – 1.0742
S3 – 1.0681
Nearest resistance levels:
R1 – 1.0864
R2 – 1.0925
R3 – 1.0986
Trading recommendations:
The EUR/USD pair remains below the moving average line. Therefore, we continue to consider short positions with a target of 1.0742. The downward movement is currently quite weak, and this week's strong fundamental and macroeconomic background may push the pair back up. But until it consolidates above the moving average, we only consider selling. We plan to return to long positions by consolidating the price above the moving average with a target of 1.0925. In cases of consolidation above the moving average, it will be necessary to see after which event this happened. It is not excluded that the pair will quickly return.
Explanations for illustrations:
Linear regression channels - help determine the current trend. The trend is currently strong if both are directed in the same direction.
The moving average line (settings 20.0, smoothed) - determines the short-term trend and the direction in which it is currently advisable to trade.
Murray levels - target levels for movements and corrections.
Volatility levels (red lines) - the probable price channel in which the pair will spend the next day, based on current volatility indicators.
CCI indicator - its entry into the oversold zone (below -250) or the overbought zone (above +250) indicates that a trend reversal in the opposite direction is approaching.
 English
 Русский
 Bahasa Indonesia
 Bahasa Malay
 ไทย
ไทย Español
 Deutsch
 Български
 Français
 Tiếng Việt
 中文
中文 বাংলা
বাংলা हिन्दी
 Čeština
 Українська
 Română

