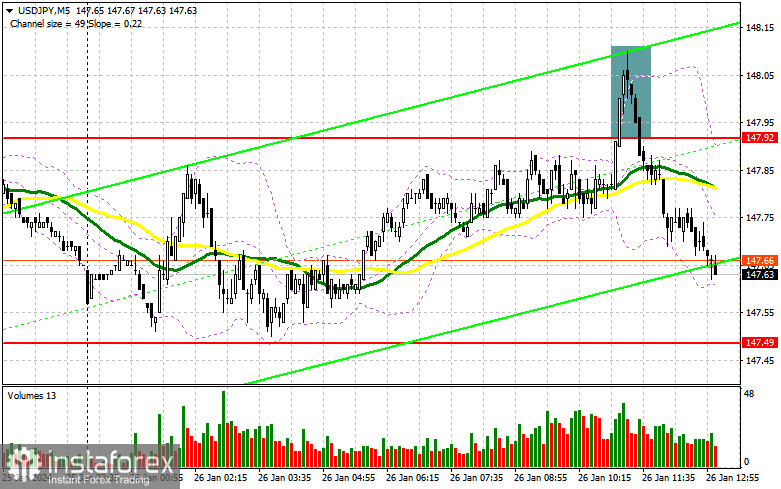
In my morning forecast, I paid attention to the level of 147.92 and planned to make entry decisions based on it. Let's take a look at the 5-minute chart and analyze what happened there. The rise and the formation of a false breakout at 147.92 led to an entry point for selling the dollar, resulting in a drop in the pair by more than 30 points. In the second half of the day, the technical picture was slightly revised.

To open long positions on USD/JPY:
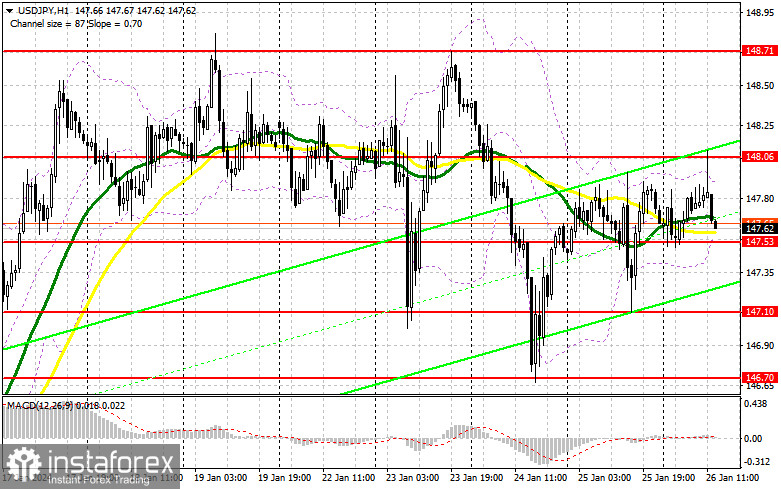
It all depends on the US data, especially the Personal Consumption Expenditures (PCE) Index. If the numbers match economists' expectations, then attention should be focused on the growth of American expenditure and income. The recovery of these indicators may lead to further strengthening of USD/JPY in the second half of the day. For this reason, the most acceptable scenario for me in the current conditions would be buying on a dip near the new support at 147.53, formed after the first half of the day. Only the formation of a false breakout there will confirm the right conditions for entering long positions, with the expectation of a rebound towards 148.06 – a resistance level also formed during the European session. Breaking and retesting this range from top to bottom will offer another opportunity to increase long positions, capable of pushing USD/JPY up towards 148.71. The ultimate target will be the 149.32 area, where I plan to take profits. In the scenario of the pair's decline and the absence of activity from buyers at 147.53 in the second half of the day, pressure on the dollar will persist, leading to a continuation of the downward correction. However, I won't set my sights on a major sell-off. I will try to enter the market around 147.10. Only a false breakout there will be a good condition for opening long positions. I plan to buy USD/JPY immediately on a rebound only from the minimum of around 146.70, with the goal of an intraday correction of 30-35 points.
To open short positions on USD/JPY:
Sellers have attempted, but they have not been able to break out of the sideways channel. Active defense of the middle of the range is already a significant achievement, especially considering the recent market conditions. Weak US data may help protect 148.06 during the American session. I would prefer to open short positions there only on a false breakout, with the target of a drop towards 147.53, where the moving averages, favoring the bulls, are located. Breaking and retesting this range from below will deliver a more significant blow to the buyer's positions, leading to the removal of stop orders and opening the path to 147.10. The ultimate target will be the 146.70 area, where I plan to take profits. In the scenario of USD/JPY rising and the absence of activity at 148.06 in the second half of the day, which will only happen if data is indicating an increase in consumer spending, buyers will continue to gain an advantage. In such a case, it's best to postpone selling against the trend until testing the next resistance at 148.71. If there is no downward movement there, I will sell USD/JPY immediately on a rebound from 149.32, but only with the expectation of a pair correction downwards by 30-35 points.
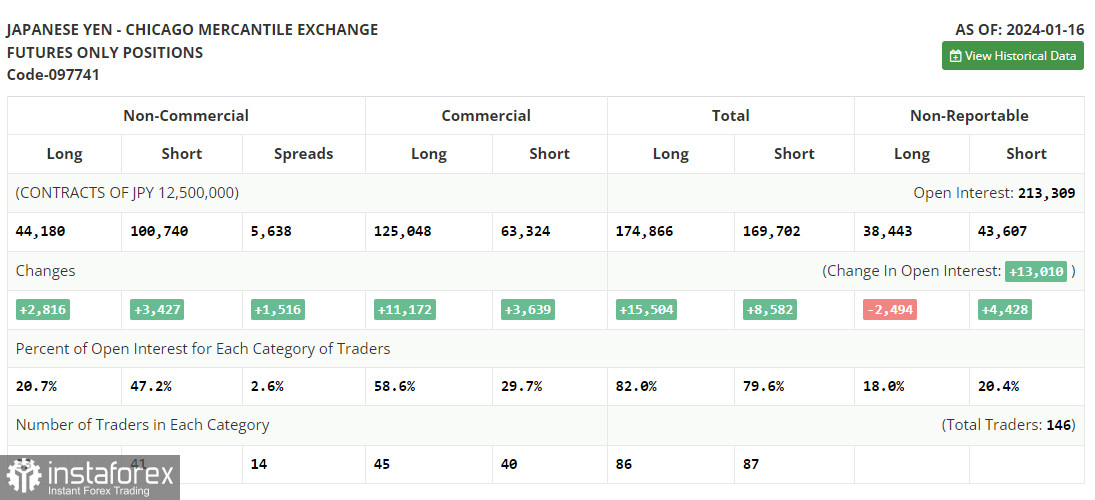
In the Commitment of Traders (COT) report for January 16, there was an increase in both long and short positions. Recently, inflation data for Japan was released, and the numbers were not entirely positive. Slowing price pressure may have a restraining effect on the Bank of Japan, which is increasingly considering rolling back its ultra-loose monetary policy. In the near future, the regulator will hold a meeting where it will decide to keep interest rates unchanged. It is crucial how the head of the Bank of Japan characterizes the future policy and whether he changes his plans for its normalization in the first half of this year. If everything goes as planned, pressure on the USD/JPY pair may return. In the latest COT report, it is stated that long non-commercial positions increased by 2,816 to 44,180, while short non-commercial positions rose by 3,427 to 100,740. As a result, the spread between long and short positions increased by 1,516.

Indicator Signals:
Moving Averages:
Trading is taking place around the 30-day and 50-day moving averages, indicating a sideways market.
Note: The period and prices of moving averages considered by the author are on the hourly chart (H1) and differ from the general definition of classical daily moving averages on the daily chart (D1).
Bollinger Bands:
In case of a decline, the lower boundary of the indicator at around 147.53 will act as support.
Indicator Descriptions:
- Moving average (smooths out volatility and noise to determine the current trend). Period - 50. Marked in yellow on the chart.
- Moving average (smooths out volatility and noise to determine the current trend). Period - 30. Marked in green on the chart.
- MACD indicator (Moving Average Convergence/Divergence) with Fast EMA - 12, Slow EMA - 26, and SMA - 9.
- Bollinger Bands indicator. Period - 20.
- Non-commercial traders are speculators such as individual traders, hedge funds, and large institutions using the futures market for speculative purposes and meeting certain requirements.
- Long non-commercial positions represent the total long open positions of non-commercial traders.
- Short non-commercial positions represent the total short open positions of non-commercial traders.
- The total non-commercial net position is the difference between the short and long positions of non-commercial traders.
 English
 Русский
 Bahasa Indonesia
 Bahasa Malay
 ไทย
ไทย Español
 Deutsch
 Български
 Français
 Tiếng Việt
 中文
中文 বাংলা
বাংলা हिन्दी
 Čeština
 Українська
 Română

