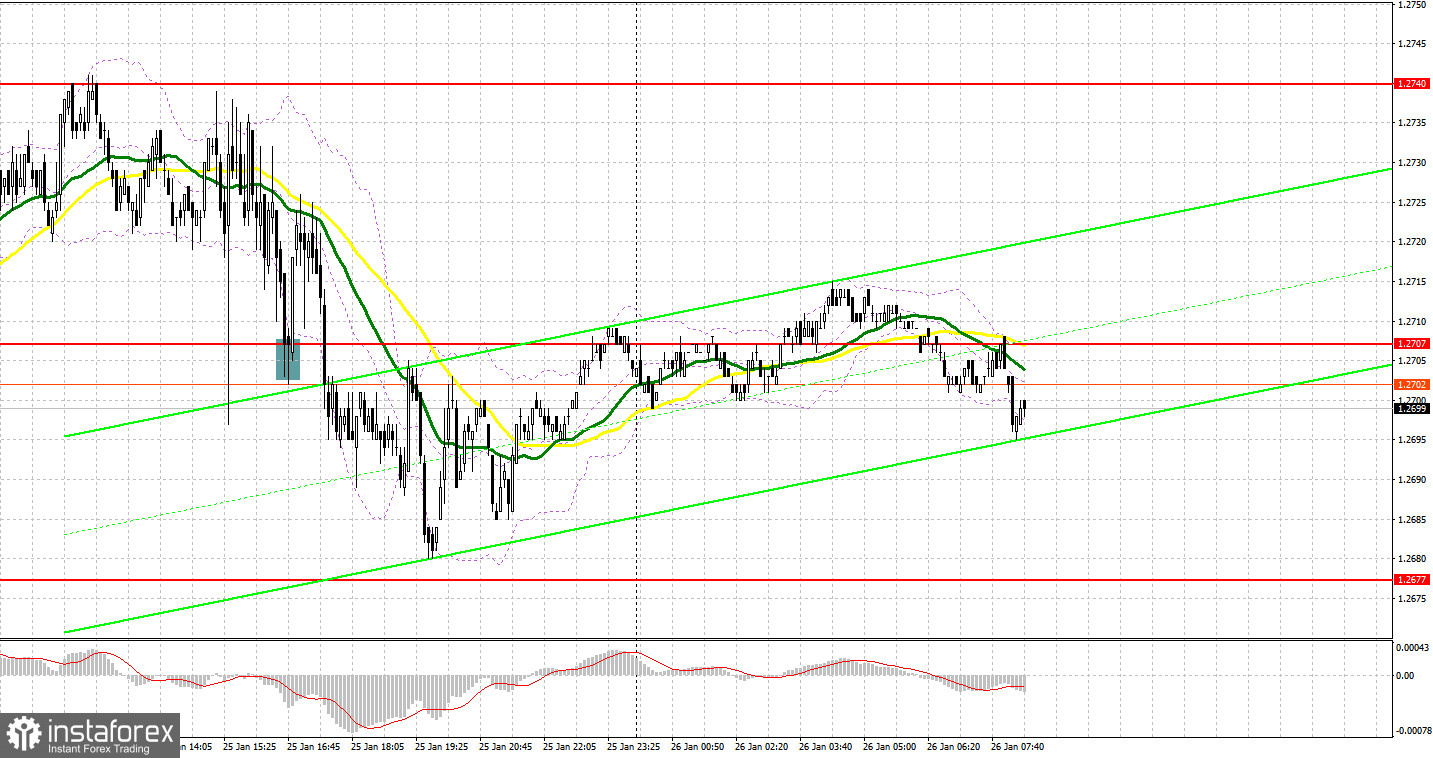
Yesterday, GBP/USD generated several signals to enter the market. Now let's look at the 5-minute chart and try to figure out what actually happened. In my previous forecast, I indicated the level of 1.2728 and planned to make decisions on entering the market from there. A rise and a false breakout at this level suggested an entry point for sell positions, but the pair did not actively fall. In the afternoon, an attempt to defend 1.2707 generated a buy signal, but after rising by 18 pips, the pressure on the pair returned.

For long positions on GBP/USD:
Strong US data put pressure on the British pound, but it suffered much less than other risk assets. This is due to the Bank of England's tough stance on monetary policy, which is in contrast to the European Central Bank. Today, the UK will not release any economic reports, so traders are hoping to maintain purchasing power. In case the pair falls in the first half of the day, I will try to buy near the nearest support at 1.2681, established at the end of yesterday. A false breakout on this mark will give an entry point in development of an uptrend with the goal of testing 1.2714. Just below this level, we have the moving averages that favor the bears. A breakout and consolidation above this range will strengthen the demand for the pound and open the way to 1.2740. The farthest target will be the 1.2771 high, where I will take profits. In a scenario where GBP/USD falls and there are no bulls at 1.2681, things will go rather badly for the buyers, and this would mean that the pair will no longer follow the uptrend. If this happens, I will postpone long positions until the test of 1.2649. Only a false breakout there will confirm the correct entry point. You can open long positions on GBP/USD immediately on a rebound from the low of 1.2623, bearing in mind an intraday correction of 30-35 pips.
For short positions on GBP/USD:
Yesterday afternoon, sellers emerged after the strong US data and now they need to prevent the pair from going beyond the new resistance at 1.2714, from where I am going to act. A false breakout at this level would confirm the presence of major players in the market, creating a sell signal that will give bears a chance to move the price down to the target at 1.2681. A breakout and an upward retest of this range will deal a more serious blow to the bulls' positions, leading to the removal of stop orders and open the way to 1.2649. A lower target will be 1.2623, where I will take profits. If GBP/USD grows and there are no bears at 1.2714, the bulls will regain the opportunity to develop a new uptrend - which would at least keep the pair trading within the sideways channel. I would delay short positions until a false breakout at 1.2740. If there is no downward movement there, I will sell GBP/USD immediately on a bounce right from 1.2771, considering a downward correction of 30-35 pips within the day.

COT report:
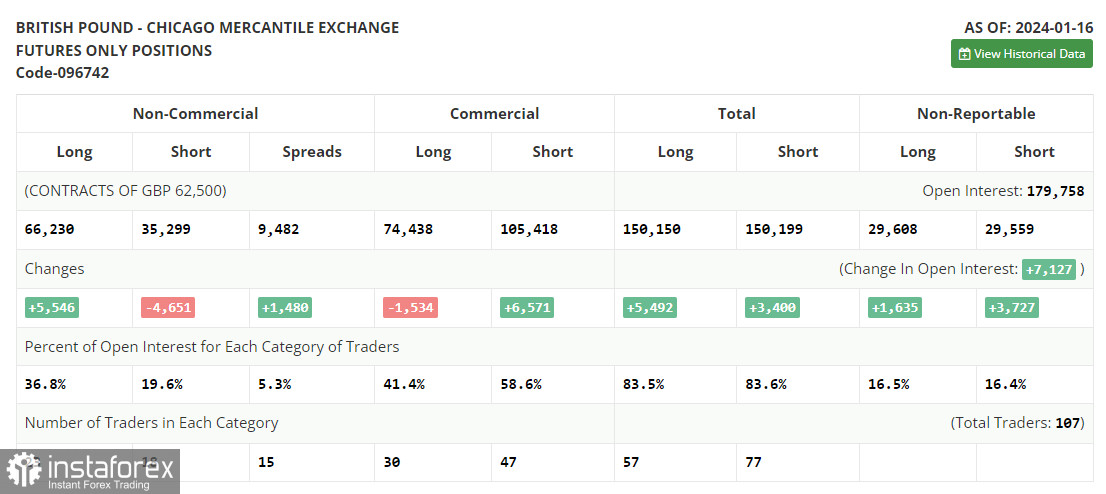
In the COT report (Commitment of Traders) for January 16, we find a decline in short positions and an increase in long ones. Macroeconomic data released recently, especially any report related to inflation, allow the British pound to stay afloat. Lately, Bank of England's policymakers have made it clear that they will continue to keep interest rates at current highs and struggle against stubborn inflation even despite ongoing economic woes. This is both good and bad for the pound sterling. GBP may benefit in the short term, but the outlook is bearish in the long term, since normalization of GDP growth rates will take longer than expected. In the near future, activity data for January will shed light on the current state of affairs. The latest COT report said that long non-commercial positions rose by 5,546 to 66,230, while short non-commercial positions fell by 4,651 to 35,299. As a result, the spread between long and short positions increased by 1,480.

Indicator signals:
Moving Averages
Trading just around the 30- and 50-day moving averages indicates sideways movement.
Please note that the time period and levels of the moving averages are analyzed only for the H1 chart, which differs from the general definition of the classic daily moving averages on the D1 chart.
Bollinger Bands
If GBP/USD falls, the indicator's lower boundary near 1.2681 will serve as support.
Description of indicators:
• A moving average of a 50-day period determines the current trend by smoothing volatility and noise; marked in yellow on the chart;
• A moving average of a 30-day period determines the current trend by smoothing volatility and noise; marked in green on the chart;
• MACD Indicator (Moving Average Convergence/Divergence) Fast EMA with a 12-day period; Slow EMA with a 26-day period. SMA with a 9-day period;
• Bollinger Bands: 20-day period;
• Non-commercial traders are speculators such as individual traders, hedge funds, and large institutions who use the futures market for speculative purposes and meet certain requirements;
• Long non-commercial positions represent the total number of long positions opened by non-commercial traders;
• Short non-commercial positions represent the total number of short positions opened by non-commercial traders;
• The non-commercial net position is the difference between short and long positions of non-commercial traders.
 English
 Русский
 Bahasa Indonesia
 Bahasa Malay
 ไทย
ไทย Español
 Deutsch
 Български
 Français
 Tiếng Việt
 中文
中文 বাংলা
বাংলা हिन्दी
 Čeština
 Українська
 Română

