Analysis of EUR/USD 5M

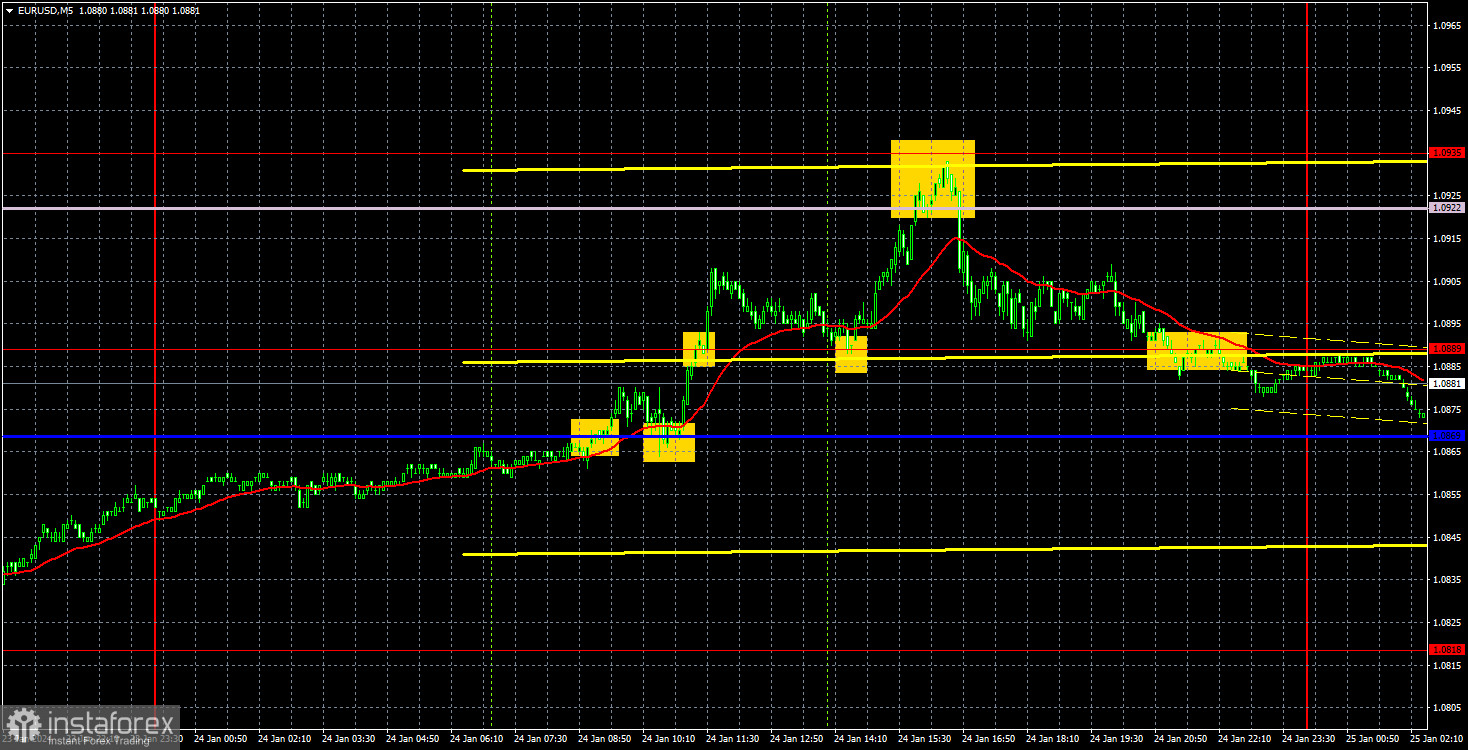
Yesterday, EUR/USD traded with strong positivity. The single currency slumped on Tuesday, but surprisingly, it was able to recoup its losses. Moreover, we can't say that the euro had valid reasons to fall on Tuesday and rise on Wednesday.
And it all ended very simply. At the moment, the price has returned to the levels it was at the beginning of Tuesday. That is, from the current levels, the price initially edged up, then it fell a lot, then grew even more, and then returned to the initial positions. It was such a roller coaster ride for the euro.
Yesterday, data on the index of business activity in the manufacturing and services sector were published in the European Union and the United States. And although these were not crucial reports, we warned you that they could affect the pair's movement. However, they ultimately influenced the pair in a different manner than what we expected. The euro continued to rise even if the EU and Germany released mediocre reports. When the US released PMI data, significantly exceeding forecasts, the dollar started to rise. However, we only associate the pair's movement with these indices in the first hour after their release. The rest of the movement had nothing to do with these reports.
Today, the European Central Bank is scheduled to hold its first monetary policy meeting, and it seems that the movements of the past two days have been in preparation for this event. It's difficult to understand what the market had in mind, as the pair moved in different directions. One thing is clear - the market does not have a clear opinion on the ECB's actions and ECB President Christine Lagarde's rhetoric. And this means that the pair can fly in different directions today.
Speaking of trading signals, there were many of them, and the majority of them were quite good. First, the price broke above the Kijun-sen, which was a reason to open long positions, and subsequently, it tested the 1.0922-1.0935 area, from which it rebounded. At this point, it was necessary to close long positions and open short ones, and the pair managed to return to the 1.0889 level by the end of the day, where profit should have been taken. In total, you could earn about 50 pips from these two trades.
COT report:

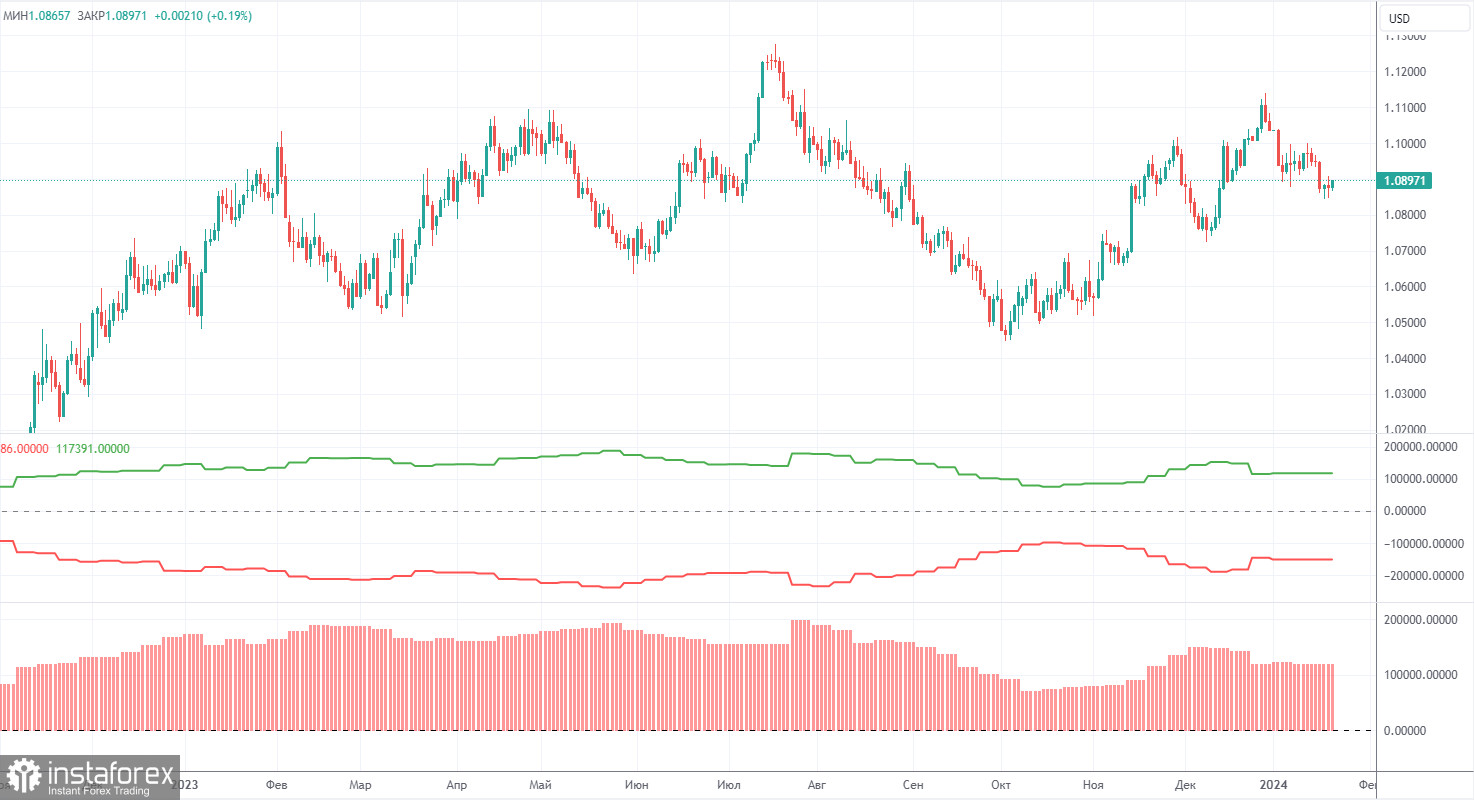
The latest COT report is dated January 16th. As seen in the charts above, it is clear that the net position of non-commercial traders has been bullish for quite some time. To put it simply, the number of long positions is much higher than the number of short positions. This should support the euro, but we still do not see fundamental factors for the euro to strengthen further. In recent months, both the euro and the net position have been rising. However, over the past few weeks, big players have started to reduce their long positions, and we believe that this process will continue.
We have previously pointed out that the red and green lines have moved apart from each other, which often precedes the end of a trend. At the moment, these lines are still far apart. Therefore, we support the scenario in which the euro should fall and the uptrend must end. During the last reporting week, the number of long positions for the non-commercial group decreased by 4,200, while the number of short positions increased by 10,600. Consequently, the net position fell by 14,800. The number of buy contracts is still higher than the number of sell contracts among non-commercial traders by 104,000. The gap is quite large, and even without COT reports, it is clear that the euro should continue to fall.
Analysis of EUR/USD 1H

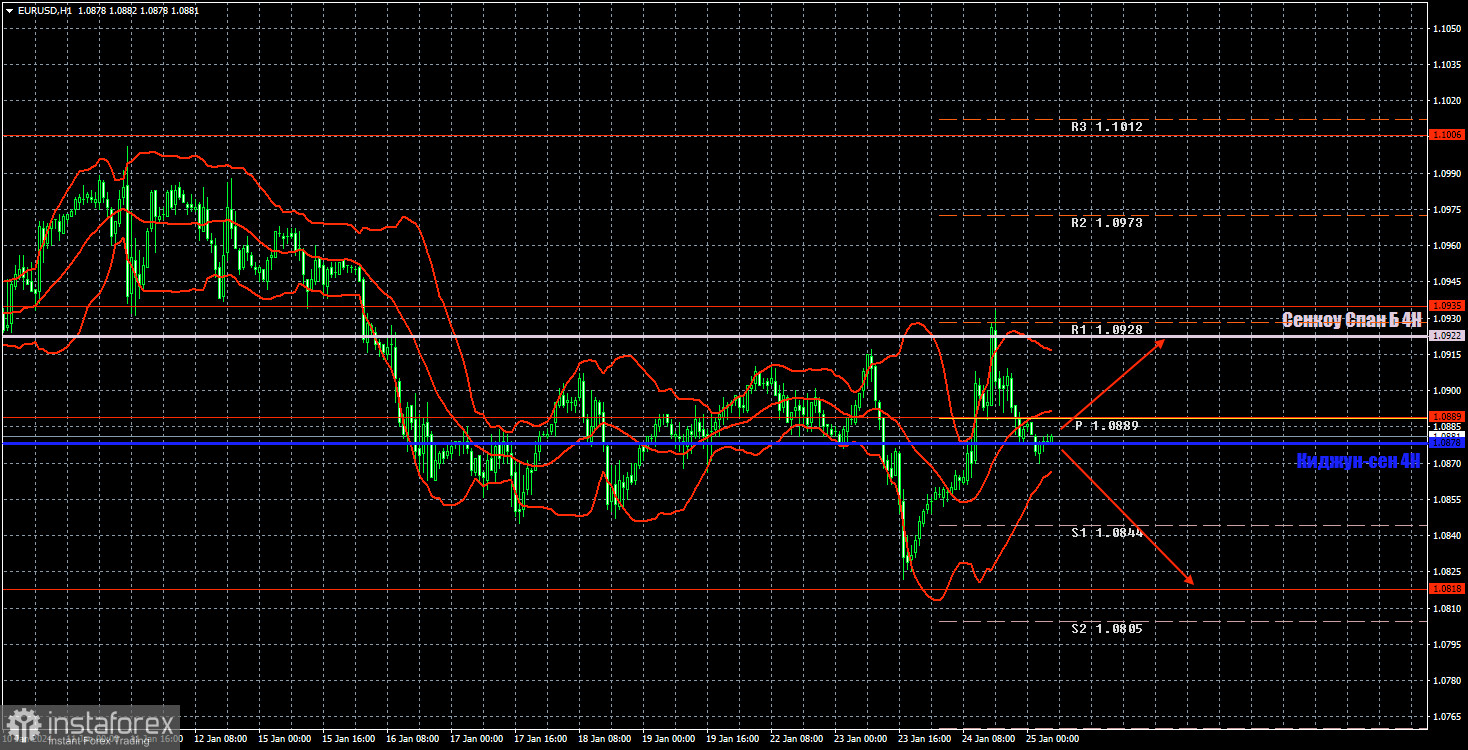
On the 1-hour chart, EUR/USD tested the Senkou Span B line but couldn't settle above it. Everything indicates that the euro has corrected higher and is now ready for a new decline. We fully support this scenario, but today's ECB meeting could potentially trigger a new upward movement.
Today, it makes sense to consider short positions with a target at 1.0818 if the price breaches the critical line. There may be buying opportunities on a bounce from the critical line with a target at 1.0922. On Thursday, the movement will depend on the fundamental background.
On January 25, we highlight the following levels for trading: 1.0658-1.0669, 1.0757, 1.0818, 1.0889, 1.0935, 1.1006, 1.1092, 1.1137, 1.1185, 1.1234, 1.1274, as well as the Senkou Span B line (1.0922) and the Kijun-sen (1.0878). The Ichimoku indicator lines can move during the day, so this should be taken into account when identifying trading signals. Don't forget to set a breakeven Stop Loss if the price has moved in the intended direction by 15 pips. This will protect you against potential losses if the signal turns out to be false.
The European Central Bank policy decision is due Thursday, and ECB President Christine Lagarde's news conference follows later. These two events alone are capable of creating turbulence in the market. The U.S. will release important reports on GDP in the fourth quarter and durable goods orders.
Description of the chart:
Support and resistance levels are thick red lines near which the trend may end. They do not provide trading signals;
The Kijun-sen and Senkou Span B lines are the lines of the Ichimoku indicator, plotted to the 1H timeframe from the 4H one. They provide trading signals;
Extreme levels are thin red lines from which the price bounced earlier. They provide trading signals;
Yellow lines are trend lines, trend channels, and any other technical patterns;
Indicator 1 on the COT charts is the net position size for each category of traders;
Indicator 2 on the COT charts is the net position size for the Non-commercial group.
 English
 Русский
 Bahasa Indonesia
 Bahasa Malay
 ไทย
ไทย Español
 Deutsch
 Български
 Français
 Tiếng Việt
 中文
中文 বাংলা
বাংলা हिन्दी
 Čeština
 Українська
 Română

