 English
  Русский
 Bahasa Indonesia
 Bahasa Malay
 ไทย
ไทย Español
 Deutsch
 Български
 Français
 Tiếng Việt
 中文
中文 বাংলা
বাংলা हिन्दी
 Čeština
 Українська
 Română

Analyzing Tuesday's trades:
GBP/USD on 1H chart
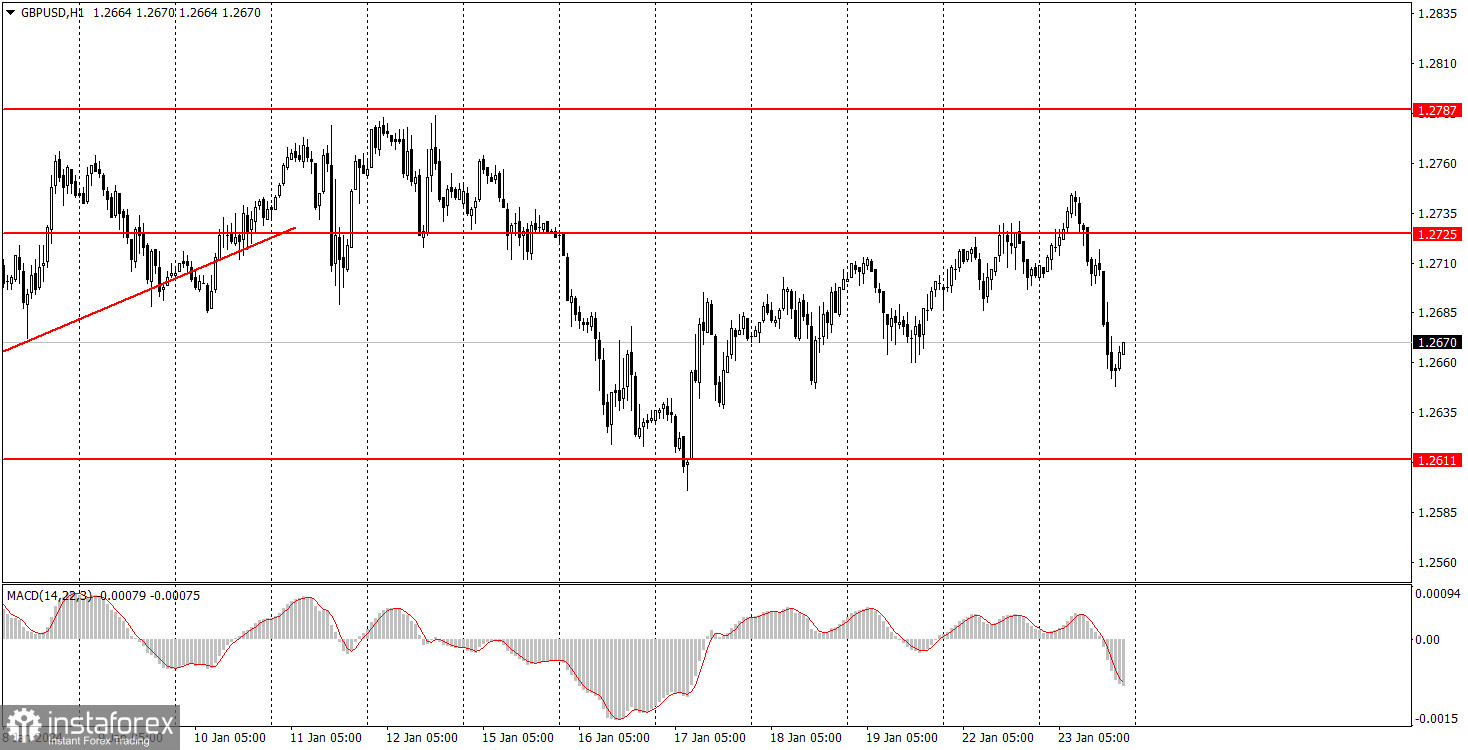
The GBP/USD pair also sharply reversed downwards and started a fairly significant decline. To be honest, the decline doesn't mean anything at all. It wasn't triggered by a bounce from an important level or a significant fundamental/macroeconomic event. At a certain point in time, the pair simply started to move downwards. Therefore, the price temporarily stopped moving towards the upper boundary of the sideways channel, but that doesn't mean that it won't go back on Wednesday. It is important to remember that a flat market could always turn out to be random, and it is impossible to predict its end in advance. We can only react to signals, and currently, there are no signals indicating the end of the flat.
There were no significant events in either the UK or the US. Therefore, what we witnessed was a simple retracement within the context of an upward movement within the sideways channel. It is pointless to expect the start of a downtrend until the price firmly settles below the level of 1.2611. However, this is the progress we are waiting for.
GBP/USD on 5M chart
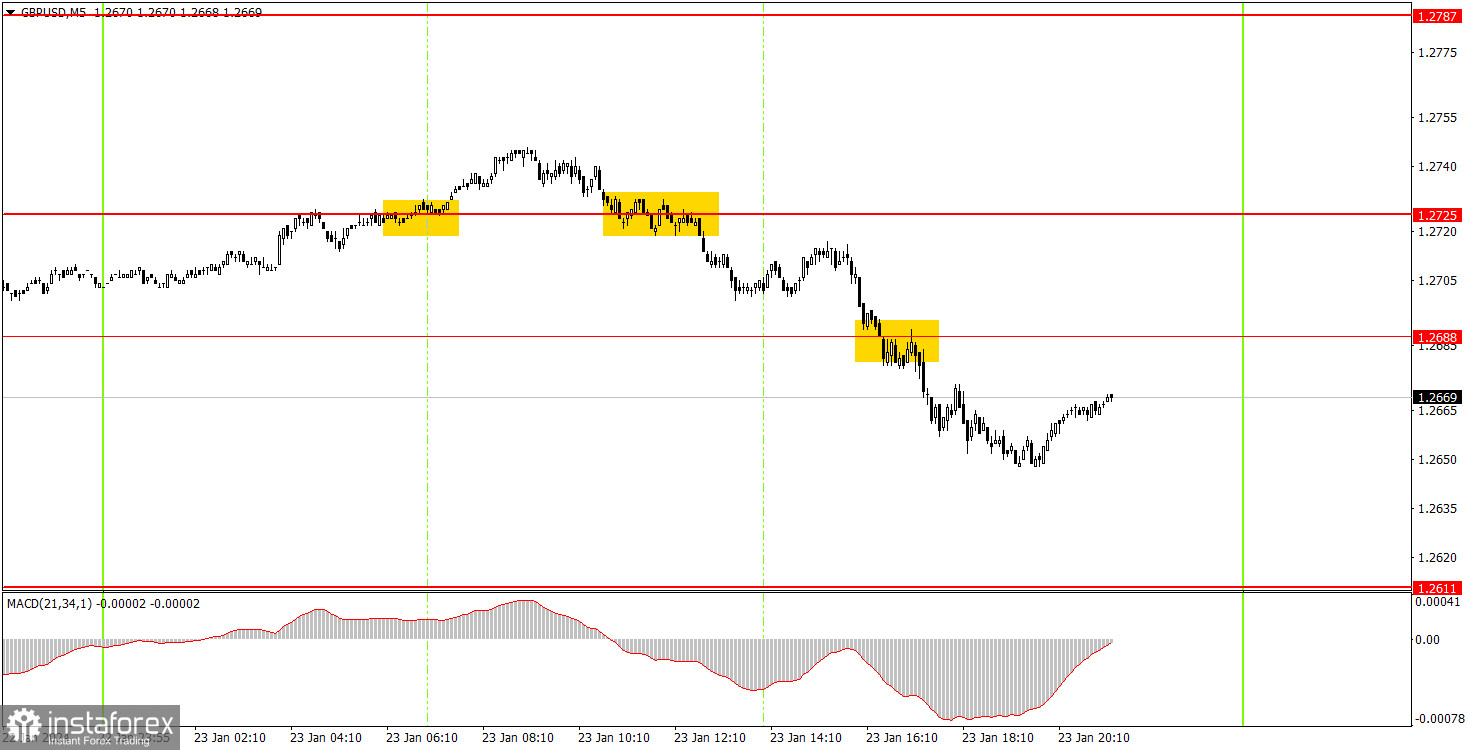
The pair's movements on the 5-minute timeframe were more volatile compared to Friday or Monday. It all started with a false buy signal forming around the level of 1.2725. The pair managed to move in the intended direction by only 10 pips, so it was not possible to set a Stop Loss. The trade closed with a loss of about 25 pips when the pair settled below 1.2725. The new sell signal turned out to be much better than the last one, and the price has moved down 40-60 pips up to the current moment. There were no more buy signals, so the short position could have been closed anywhere during the U.S. trading session. In any case, it closed with a profit exceeding the loss from the first trade.
Trading tips on Wednesday:
On the hourly chart, GBP/USD is still trading within the sideways channel of 1.2611-1.2787. The price bounced off the level of 1.2611 five times, and after the last bounce, a new uptrend has started within the flat, which is clearly visible on the 4-hour timeframe. Now the price can gradually rise towards the upper boundary of the sideways channel.
On Wednesday, the British pound will likely remain within the confines of the sideways channel. It's hard to believe that PMI data will trigger such a strong market reaction that the pair will leave the sideways channel, where it has been for more than a month now. Currently, the price is not even near either of the boundaries of the sideways channel.
The key levels on the 5M chart are 1.2270, 1.2310, 1.2372-1.2387, 1.2457, 1.2502, 1.2544, 1.2605-1.2611, 1.2688, 1.2725, 1.2787-1.2791, 1.2848-1.2860, 1.2913, 1.2981-1.2993. On Wednesday, PMI data for the services and manufacturing sectors for January will be published in the UK and the US. The market doesn't expect significant changes in these indicators, so reaction may be subdued, which clearly won't be enough for the pound to break out of the flat.
Basic trading rules:
1) Signal strength is determined by the time taken for its formation (either a bounce or level breach). A shorter formation time indicates a stronger signal.
2) If two or more trades around a certain level are initiated based on false signals, subsequent signals from that level should be disregarded.
3) In a flat market, any currency pair can produce multiple false signals or none at all. In any case, the flat trend is not the best condition for trading.
4) Trading activities are confined between the onset of the European session and mid-way through the U.S. session, after which all open trades should be manually closed.
5) On the 30-minute timeframe, trades based on MACD signals are only advisable amidst substantial volatility and an established trend, confirmed either by a trendline or trend channel.
6) If two levels lie closely together (ranging from 5 to 15 pips apart), they should be considered as a support or resistance zone.
How to read charts:
Support and Resistance price levels can serve as targets when buying or selling. You can place Take Profit levels near them.
Red lines represent channels or trend lines, depicting the current market trend and indicating the preferable trading direction.
The MACD(14,22,3) indicator, encompassing both the histogram and signal line, acts as an auxiliary tool and can also be used as a signal source.
Significant speeches and reports (always noted in the news calendar) can profoundly influence the price dynamics. Hence, trading during their release calls for heightened caution. It may be reasonable to exit the market to prevent abrupt price reversals against the prevailing trend.
Beginners should always remember that not every trade will yield profit. Establishing a clear strategy coupled with sound money management is the cornerstone of sustained trading success.