The European Central Bank's (ECB) inflation target is 2.0%, and the published indicators still exceed this target value. ECB leaders are likely to keep interest rates at current levels at the meeting on Thursday for the next few months. This means that the euro will receive support from the ECB's wait-and-see position.
At the same time, market participants hope to hear hints from ECB representatives about the timing of the transition to monetary policy easing. If they do indeed sound, then a weakening of the euro and a fall in the EUR/JPY pair should be expected.

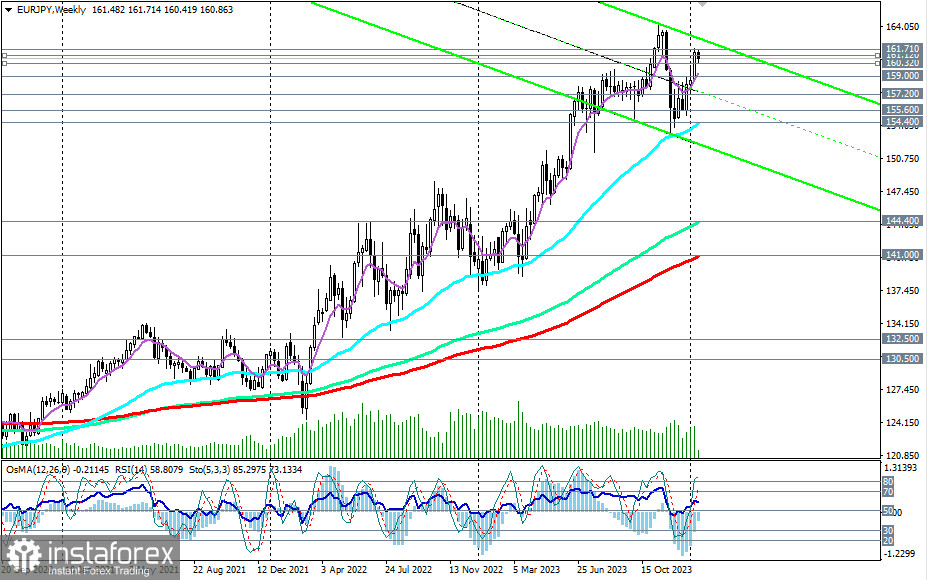
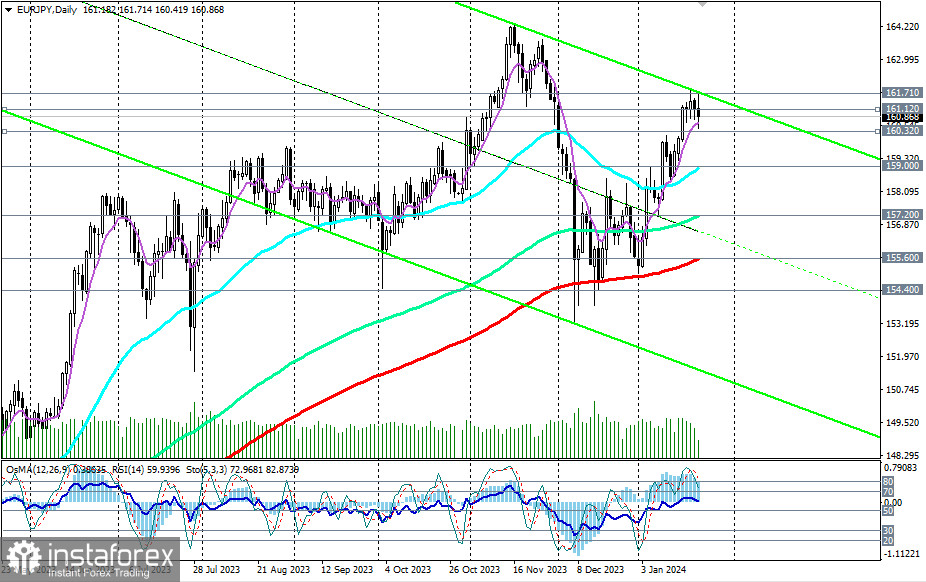
From a technical point of view, today, EUR/JPY is developing a downward correction, while remaining in the medium-term zone, above the key support level of 155.60 (200 EMA on the daily chart) and long-term bull market—above key support levels of 145.00, 144.40 (144 EMA on the weekly chart), 141.00 (200 EMA on the weekly chart).

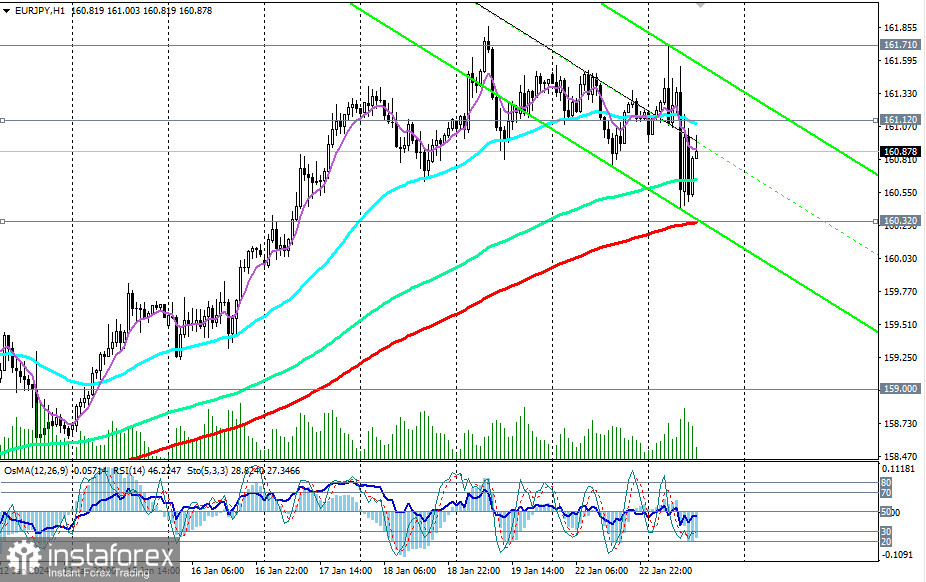
If there are no unexpected statements from the ECB leaders on Thursday, the current downward correction may be limited by the important short-term support level of 160.32 (200 EMA on the 1-hour chart).
A breakout of today's high at 161.71 could be a signal to increase long positions.
An alternative scenario is associated with a breakdown of the support level of 160.32 and the continuation of the downward correction to the support levels of 159.00 (200 EMA on the 4-hour and 50 EMA on the daily chart), from which one can consider the possibility of a rebound and resumption of growth.

In turn, their breakdown could trigger a deeper correction up to the key support levels of 157.20 (144 EMA on the daily chart) and 155.60.
For now, a stable bullish trend and a strong upward momentum prevail, so it is not advisable to count on such a decline in the pair. Long positions remain preferable.
The first signal for the resumption of the upward dynamics could be a breakout of the 161.12 mark, and then today's high at 161.71.
Support levels: 160.32, 160.00, 159.00, 158.00, 157.20, 156.00, 155.60, 154.40
Resistance levels: 161.00, 161.12, 161.70, 162.85, 163.60, 164.00, 164.30
Trading Scenarios
Alternative scenario: Sell Stop 160.20. Stop-Loss 1361.30. Targets 160.00, 159.00, 158.00, 157.20, 156.00, 155.60, 154.40, 154.00, 153.00, 144.00, 143.30, 140.00
Main scenario: Buy Stop 161.30. Stop-Loss 160.20. Targets 161.70, 162.85, 163.60, 164.00, 164.30, 165.00, 166.00
"Targets" correspond to support/resistance levels. This also does not mean that they will definitely be reached, but they can serve as a reference point when planning and placing your trading positions.
 English
 Русский
 Bahasa Indonesia
 Bahasa Malay
 ไทย
ไทย Español
 Deutsch
 Български
 Français
 Tiếng Việt
 中文
中文 বাংলা
বাংলা हिन्दी
 Čeština
 Українська
 Română

