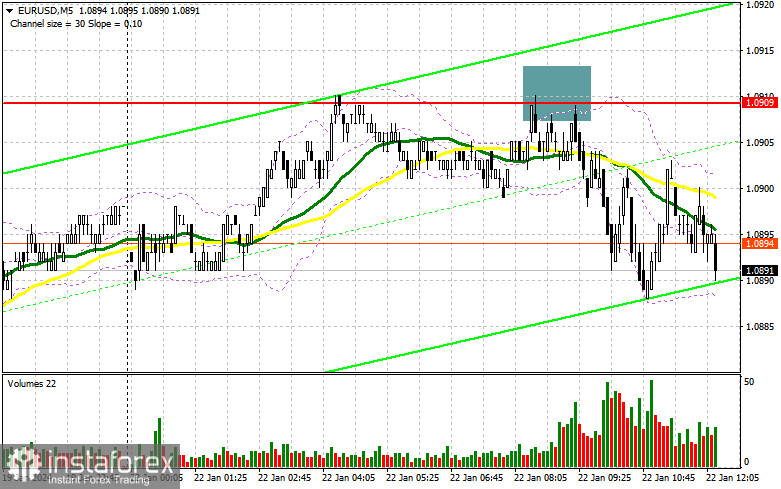
In my morning forecast, I emphasized the level of 1.0909 and planned to make trading decisions based on it. Let's look at the 5-minute chart and analyze what happened there. The rise and the formation of a false breakout around 1.0909 provided an excellent entry point for selling from the upper boundary within the sideways channel, resulting in a 20-point downward movement. In the second half of the day, the technical picture remained unchanged.

To open long positions on EUR/USD, the following conditions are required:
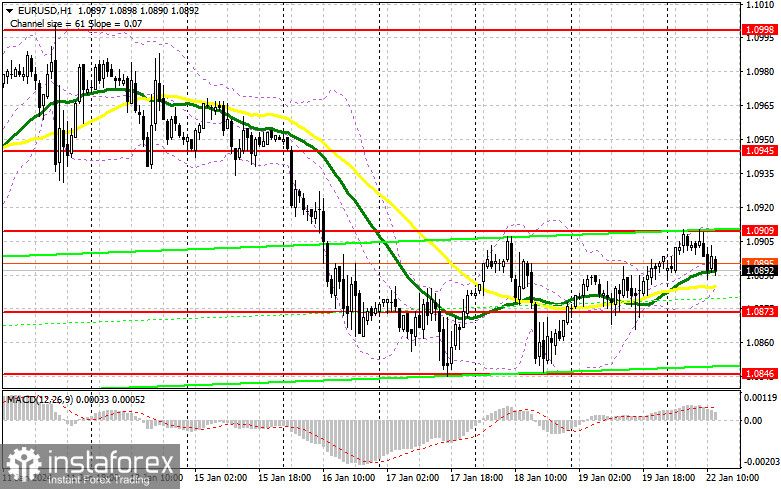
The absence of Eurozone statistics has kept trading within a sideways channel, significantly affecting intraday volatility and leaving much to be desired. Given that buyers failed to break above 1.0909 and there is no interesting data in the second half of the day, it's unlikely that we can expect an active movement in the pair. I will act following the morning plan, only on a decline and after forming a false breakout around 1.0873. An unsuccessful consolidation at this level would be a suitable entry point, counting on an upward movement towards 1.0909, where sellers have already shown themselves today. But only a breakthrough and a fresh test from top to bottom of this range will be suitable for buying with the development of an upward correction and the prospect of updating to 1.0945. The ultimate target will be at the maximum of 1.0998, where I will take profits. In the event of a decline in EUR/USD and a lack of activity at 1.0873 in the second half of the day, pressure on the pair will increase. In this case, I plan to enter the market only after forming a false breakout around 1.0846. I will open long positions immediately on the rebound from 1.0817 with a 30-35 point intraday upward correction target.
To open short positions on EUR/USD, the following conditions are required:
The bears also maintain their chances of a euro decline, as was well announced in the first half of the day. In the event of a repeated upward movement in the pair, the entry point will be the formation of a false breakout around 1.0909, indicating the presence of sellers in the market and the potential for a new downward movement towards 1.0873. However, 1.0909 has already played out once, so I recommend not rushing with decisions at this level. Missing out on 1.0873 will add to the problems for buyers. After breaking through and consolidating below 1.0873 and a retest from bottom to top, I expect to receive another selling signal with a breakout to 1.0846. The ultimate target will be a minimum of 1.0817, where I will take profits. In the event of an upward movement in EUR/USD in the second half of the day and the absence of bears at 1.0909, demand for EUR/USD will increase, leading to a larger upward correction. In this case, I will postpone sales until testing the next resistance at 1.0945. I will sell there as well, but only after an unsuccessful consolidation. I plan to open short positions immediately on the rebound from 1.0998, with a 30-35 point downward correction target.

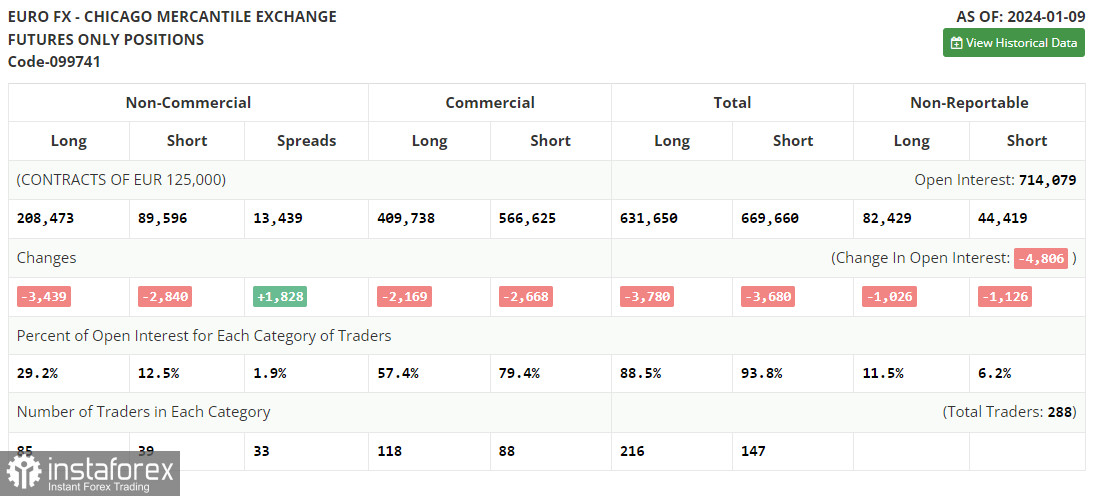
In the COT (Commitment of Traders) report for January 9th, there was a reduction in both short and long positions, which had little impact on the shift in market forces. It is evident that the pressure on the US dollar has slightly decreased, while on the euro, it has increased after news that prices in the US returned to growth in December of last year. This postpones the plans of the US Federal Reserve to reduce interest rates for a longer period. If inflation rises in January, we can remember a spring rate cut in the US, which favors the US dollar. Ahead of us, we have a series of inflation-related statistics in the Eurozone and speeches by European politicians who have recently insisted on keeping interest rates at their highs, which could support the euro this week. The COT report indicates that long non-commercial positions decreased by 3,439 to 208,473, while short non-commercial positions decreased by 2,840 to 89,596. As a result, the spread between long and short positions increased by 1,828.

Indicator Signals:
Moving Averages
Trading is conducted around the 30 and 50-day moving averages, indicating a sideways market.
Note: The period and prices of moving averages mentioned by the author are based on the hourly H1 chart and differ from the general definition of classical daily moving averages on the daily D1 chart.
Bollinger Bands
In case of a decline, the lower boundary of the indicator, around 1.0870, will act as support.
Indicator Descriptions:
• Moving Average (defines the current trend by smoothing out volatility and noise). Period 50. Marked on the chart in yellow.
• Moving Average (defines the current trend by smoothing out volatility and noise). Period 30. Marked on the chart in green.
• MACD Indicator (Moving Average Convergence/Divergence) Fast EMA period 12. Slow EMA period 26. SMA period 9.
• Bollinger Bands. Period 20.
• Non-commercial traders - speculators such as individual traders, hedge funds, and large institutions use the futures market for speculative purposes and meet certain requirements.
• Long non-commercial positions represent the total long open positions of non-commercial traders.
• Short non-commercial positions represent the total short open positions of non-commercial traders.
• The total non-commercial net position is the difference between short and long positions of non-commercial traders.
 English
 Русский
 Bahasa Indonesia
 Bahasa Malay
 ไทย
ไทย Español
 Deutsch
 Български
 Français
 Tiếng Việt
 中文
中文 বাংলা
বাংলা हिन्दी
 Čeština
 Українська
 Română

