Analysis of EUR/USD 5M

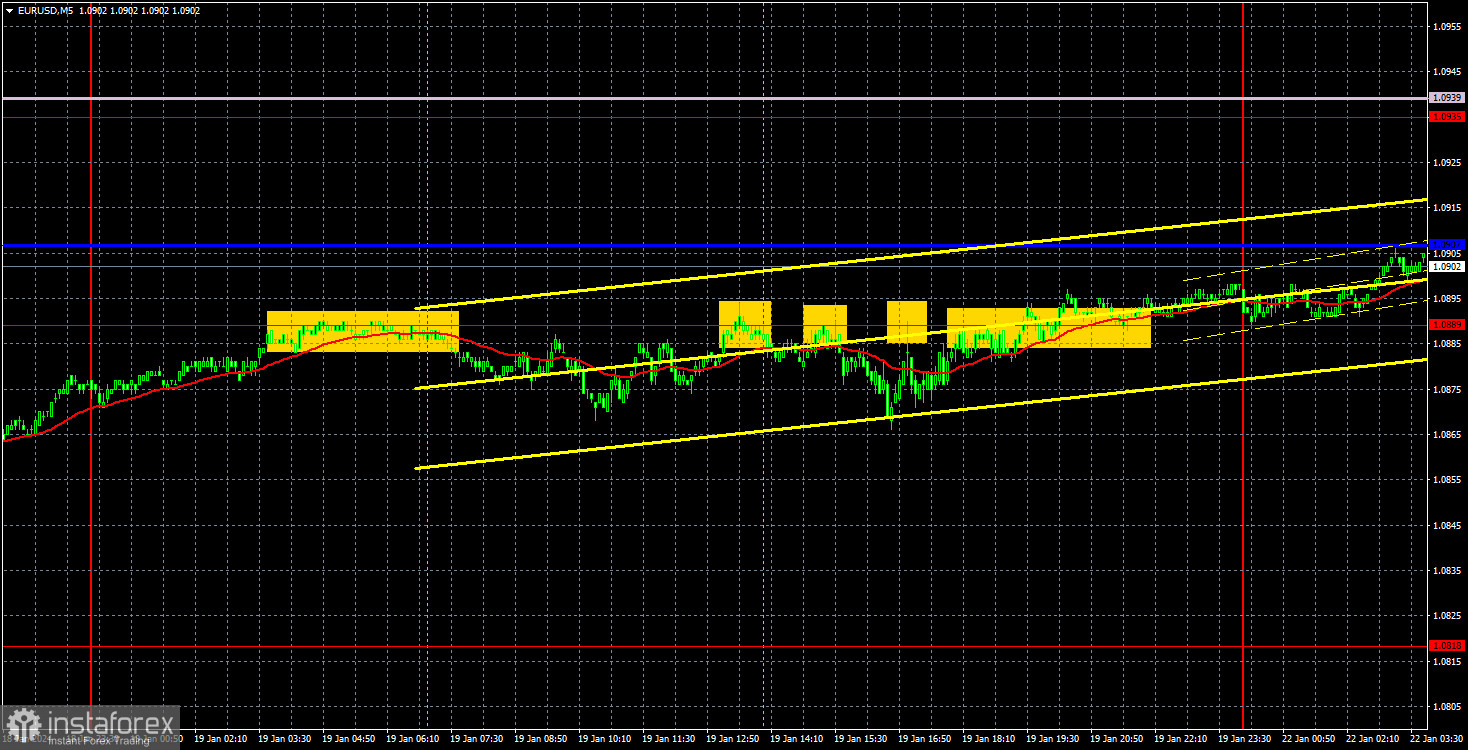
EUR/USD moved by 32 pips on Friday. In general, the pair did not show any movement at all; it simply stood still all day, which is clearly visible on the 5-minute chart. Therefore, there is not much to analyze. The pair has risen to the Kijun-sen line for the second time and may now bounce off it. If this happens, we should expect a new downward movement, which could be stronger than the last ones and become part of a new downtrend, or it could be part of a flat pattern between the levels of 1.0907 and 1.0850.
In fact, a flat pattern is quite possible at the moment. The British pound has been trading in a sideways channel for over a month, so how can the euro be any worse? Of course, this is a joke, as it would be very difficult to trade in a flat phase, and sometimes it's even pointless. However, the European Central Bank meeting will be held this week, and traders are probably waiting for this event to determine their next move.
On Friday, ECB President Christine Lagarde spoke three times last week. She did not mention anything significant for the market, but it is already clear that any important information, if there is any at all, will be announced after the ECB meeting on Thursday. The US released a consumer sentiment report, which significantly exceeded the forecasted values. However, this did not help the US dollar, as the market simply refused to trade the pair. We can say that the US currency had a good opportunity to appreciate, but it didn't take advantage of it.
Speaking of trading signals, it wouldn't make much sense to discuss them since 32 pips of volatility did not present any opportunities for traders to make significant profit. During the day, the price bounced off the level of 1.0889 four times, and in the best case, it fell by 15 pips. This was enough to set a Stop Loss to breakeven and protect oneself. Therefore, there could be no losses on Friday, but there were no significant profits either.
COT report:

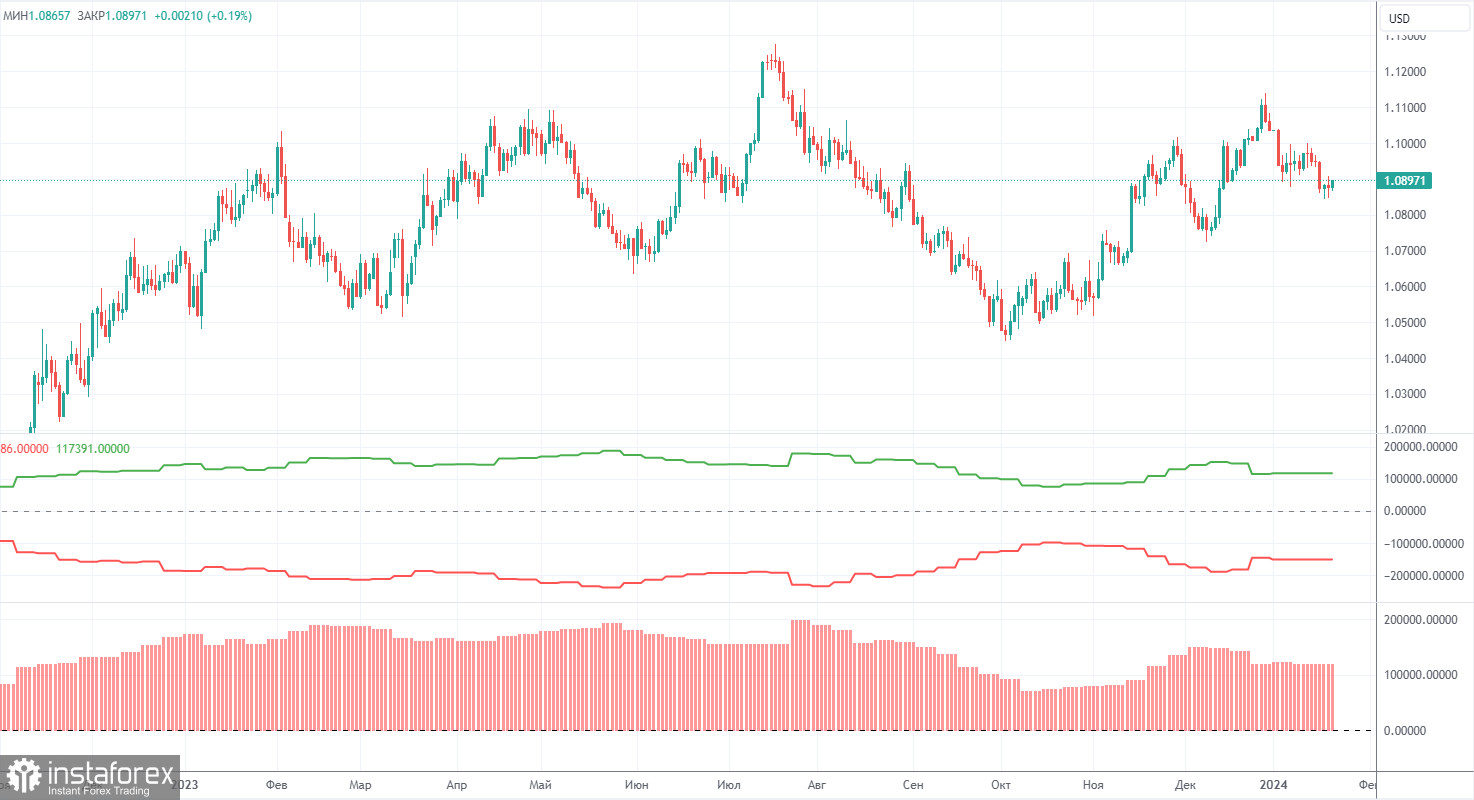
The latest COT report is dated January 16th. As seen in the charts above, it is clear that the net position of non-commercial traders has been bullish for quite some time. To put it simply, the number of long positions is much higher than the number of short positions. This should support the euro, but we still do not see fundamental factors for the euro to strengthen further. In recent months, both the euro and the net position have been rising. However, over the past few weeks, big players have started to reduce their long positions, and we believe that this process will continue.
We have previously pointed out that the red and green lines have moved apart from each other, which often precedes the end of a trend. At the moment, these lines are still far apart. Therefore, we support the scenario in which the euro should fall and the uptrend must end. During the last reporting week, the number of long positions for the non-commercial group decreased by 4,200, while the number of short positions increased by 10,600. Consequently, the net position fell by 14,800. The number of buy contracts is still higher than the number of sell contracts among non-commercial traders by 104,000. The gap is quite large, and even without COT reports, it is clear that the euro should fall.
Analysis of EUR/USD 1H

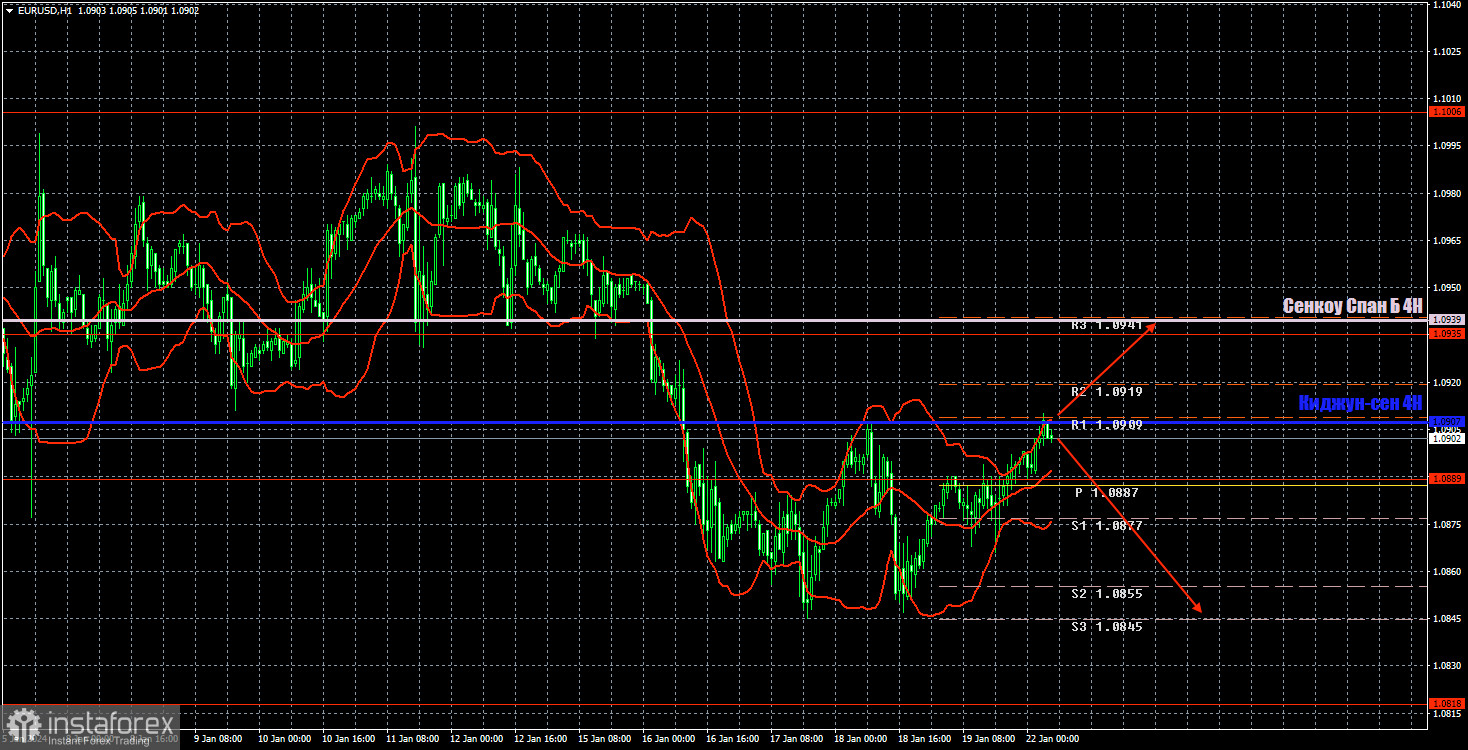
On the 1-hour chart, EUR/USD remains below the Ichimoku indicator lines, so the downtrend persists. We support a strong downward movement for the euro. The market has clearly taken a break ahead of the central bank meetings, so the pair may exhibit movement that resembles a flat for the next few days.
Today, you may consider selling with the 1.0850 level as a target. To do so, the price must bounce from the critical line. Of course, the euro could also rise, and we can identify this once the price settles above the Kijun-sen. However, the Senkou Span B line is quite close (only 30 pips away), so we would not rush to open long positions.
On January 22, we highlight the following levels for trading: 1.0658-1.0669, 1.0757, 1.0818, 1.0889, 1.0935, 1.1006, 1.1092, 1.1137, 1.1185, 1.1234, 1.1274, as well as the Senkou Span B (1.0939) and Kijun-sen (1.0907) lines. The Ichimoku indicator lines can shift during the day, so this should be taken into account when identifying trading signals. Don't forget to set a breakeven Stop Loss if the price has moved in the intended direction by 15 pips. This will protect you against potential losses if the signal turns out to be false.
On Monday, Lagarde is expected to speak, but it is unlikely for her to announce anything substantially new compared to her three speeches last week. The US event calendar is empty. Therefore, everything suggests that we can expect low volatility and a flat market for today.
Description of the chart:
Support and resistance levels are thick red lines near which the trend may end. They do not provide trading signals;
The Kijun-sen and Senkou Span B lines are the lines of the Ichimoku indicator, plotted to the 1H timeframe from the 4H one. They provide trading signals;
Extreme levels are thin red lines from which the price bounced earlier. They provide trading signals;
Yellow lines are trend lines, trend channels, and any other technical patterns;
Indicator 1 on the COT charts is the net position size for each category of traders;
Indicator 2 on the COT charts is the net position size for the Non-commercial group.
 English
 Русский
 Bahasa Indonesia
 Bahasa Malay
 ไทย
ไทย Español
 Deutsch
 Български
 Français
 Tiếng Việt
 中文
中文 বাংলা
বাংলা हिन्दी
 Čeština
 Українська
 Română

