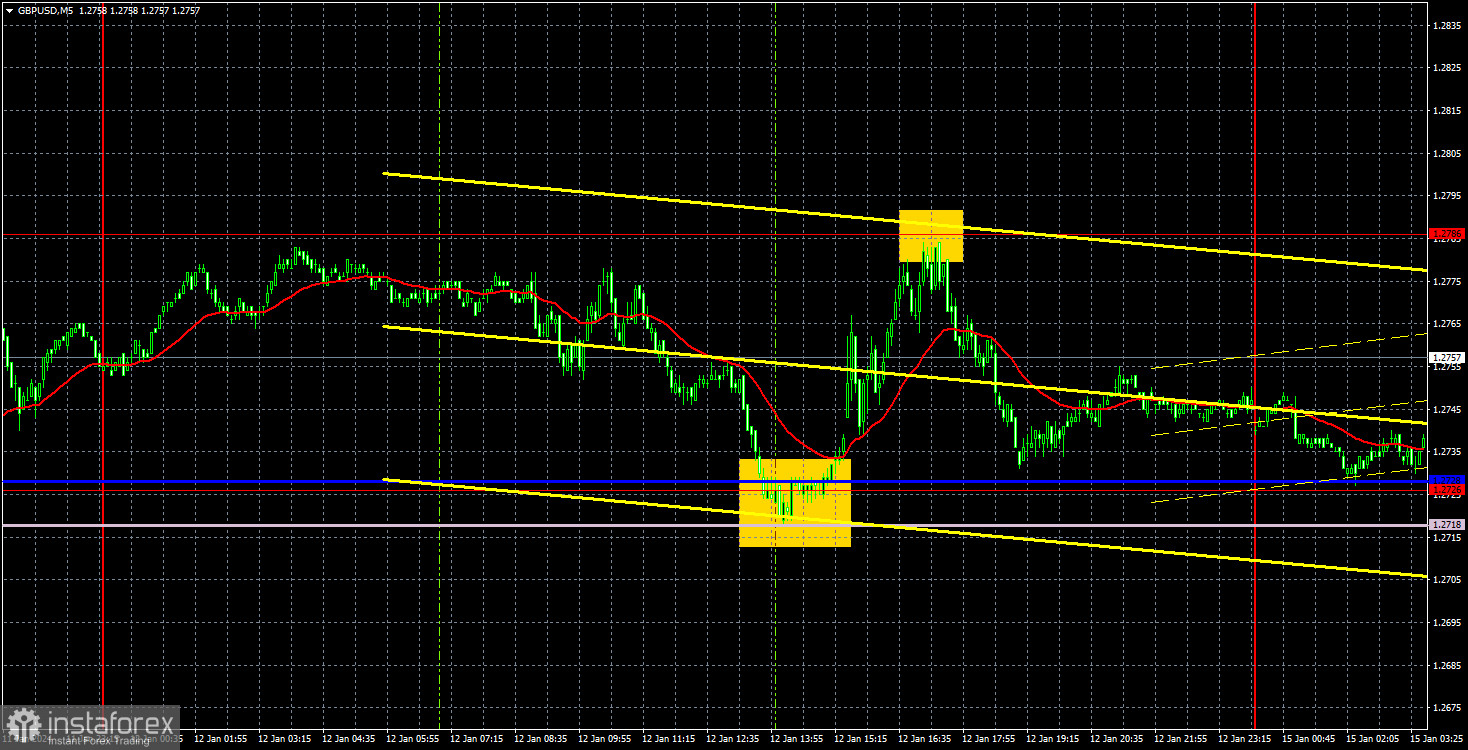
GBP/USD 5-Minute Analysis.

On Friday, the currency pair GBP/USD continued its weak upward movement within a sideways channel. While the euro is trading flat, this flat is short-term, but the British pound has been in a sideways channel for a month now. The pound's sideways channel is much wider, allowing for short-term trends. However, the nature of the pair's movement could be better.
The market continues to support strong demand for the pound because it still believes in a later first rate cut by the Bank of England than by the Federal Reserve. Despite the increase in U.S. inflation last week, reducing the likelihood of a Fed monetary policy easing in March, and several Fed representatives stating outright that a rate cut is not being considered soon, the market remains resolute. This factor is preventing the U.S. dollar from appreciating.
On Friday, industrial production and GDP reports for November were published in the United Kingdom. Still, these reports could have been more important, and their values almost completely matched the forecasts. Therefore, we did not see a strong reaction, and the flat continued. The market may be already awaiting central bank meetings in January to confirm the Fed's unwillingness to cut rates in March.
Despite the flat, two fairly good trading signals were formed on Friday. First, the price bounced off the area of 1.2718-1.2728, allowing traders to open long positions. Subsequently, the pair rose to the level of 1.2786 and rebounded from it with minimal error, allowing for closing long positions and opening short positions. By the end of the day, the price returned to the Kijun-sen line, where short positions should have been closed. These two trades could have earned about 50-60 points.
COT Report:
COT reports on the British pound show that the sentiment of commercial traders has been changing quite frequently in recent months. The red and green lines representing the net positions of commercial and non-commercial traders cross and, in most cases, are close to the zero mark. According to the latest report on the British pound, the "Non-commercial" group opened 3.0 thousand buy contracts and 1.9 thousand sell contracts. Thus, the net position of non-commercial traders increased by 1.1 thousand contracts in a week. Since large buyers do not currently have an advantage in the market, we believe the pound's rise can only last for a short time. The fundamental backdrop still needs to provide a basis for long-term pound purchases.
The "Non-commercial" group currently has 61.8 thousand contracts on purchases and 46.6 thousand contracts on sales. Since COT reports do not predict market behavior well, and the fundamentals are almost identical for both currencies, we must consider only the technical picture and macroeconomic statistics. The technicals allow for a new significant decline in the pound (but there are no clear sell signals yet). At the same time, macroeconomic data has been stronger in the United States than in the United Kingdom for a long time, which does not support the dollar.
GBP/USD 1-Hour Analysis:
On the hourly timeframe, the GBP/USD pair is not attempting to move south; it is in a wide sideways channel. The pound has no reason for long-term growth, so we expect at least a return to the 1.2513 level. However, the pair still needs to overcome the 1.2605-1.2620 area on four attempts, so it is challenging to count on a long-lasting downward trend for the pound.
On Monday, the pair may begin a new decline, reversing near the 1.2786 level, the upper boundary of the sideways channel. However, the Senkou Span B and Kijun-sen lines are pushing the price from below, so we will start considering sales with a target of 1.2620 only after the price consolidates below these lines. Buys are possible after breaking through 1.2786, but we consider such trades too risky.
For January 15th, we highlight the following important levels: 1.2215, 1.2269, 1.2349, 1.2429-1.2445, 1.2513, 1.2605-1.2620, 1.2726, 1.2786, 1.2863, 1.2981-1.2987. The Senkou Span B (1.2718) and Kijun-sen (1.2728) lines can also be sources of signals. Setting a Stop Loss level to break even when the price moves in the right direction by 20 points is recommended. The Ichimoku indicator lines may shift during the day, so consider this when determining trading signals.
On Monday, no important events or publications are planned in the United Kingdom and the United States. There will be nothing to react to during the day, so we expect the swings within the flat to continue.
Explanations for the illustrations:
Price support and resistance levels (resistance/support) - thick red lines around which movement may end. They are not sources of trading signals.
Kijun-sen and Senkou Span B lines - lines of the Ichimoku indicator transferred to the hourly timeframe from the 4-hour timeframe. They are strong lines.
Extreme levels - thin red lines from which the price previously bounced. They are sources of trading signals.
Yellow lines - trendlines, trend channels, and any other technical patterns.
Indicator 1 on the COT charts - the size of the net position of each category of traders.
Indicator 2 on the COT charts - the size of the net position for the "Non-commercial" group.
 English
 Русский
 Bahasa Indonesia
 Bahasa Malay
 ไทย
ไทย Español
 Deutsch
 Български
 Français
 Tiếng Việt
 中文
中文 বাংলা
বাংলা हिन्दी
 Čeština
 Українська
 Română

