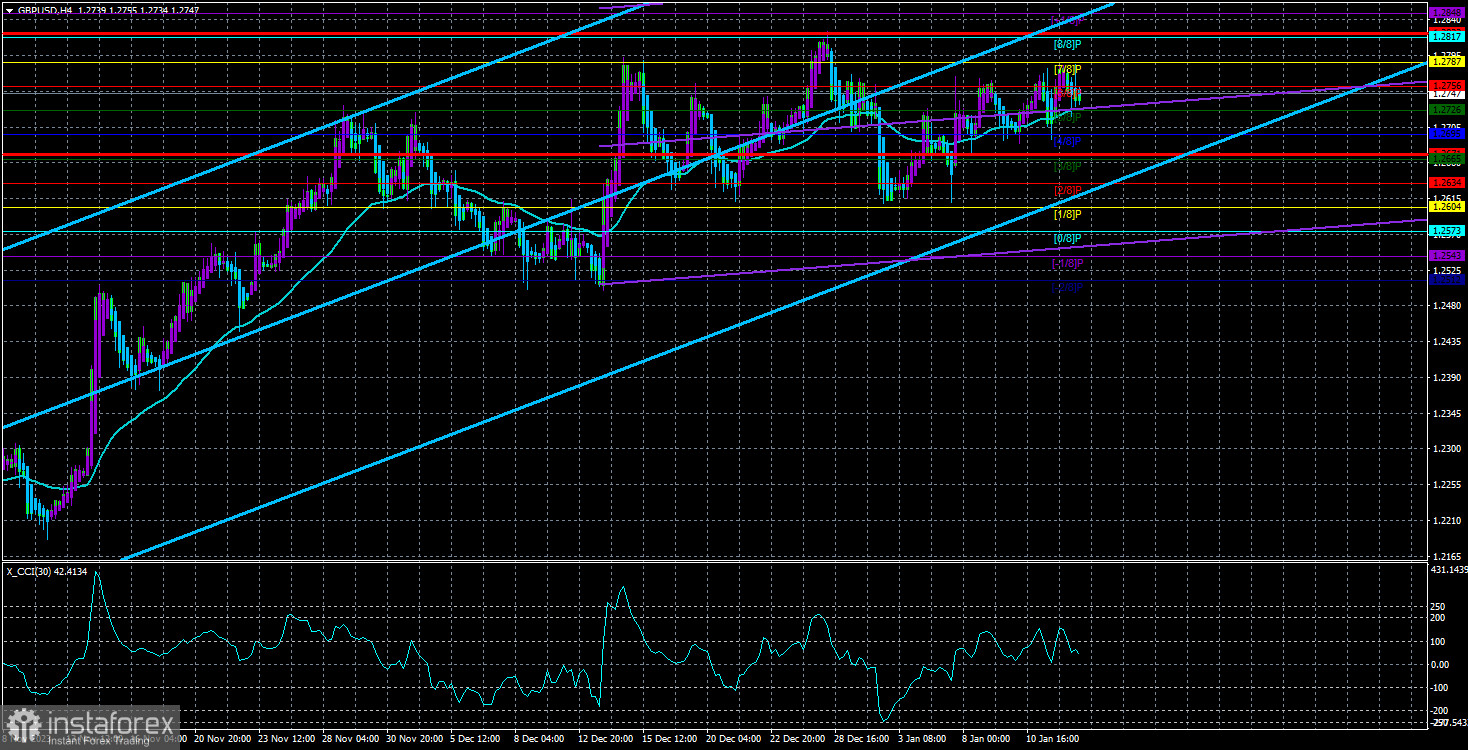
The currency pair GBP/USD continues its upward movement. Is anyone surprised by this fact? There are still chances for a good reversal pattern "head and shoulders" to form, but the current growth should end around 1.2787. If this level is surpassed, the reversal pattern will be in jeopardy, just like many other signals of a possible trend change. Let's remind ourselves that the CCI indicator has signaled strong overbought conditions for the pair four times.
Currently, the fundamental and macroeconomic background holds little significance, too. We have repeatedly pointed out that the state of the American economy is much better than that of the British. Of course, weak reports occasionally come from across the ocean, but they are much fewer than those from the UK. The pound began its upward movement as a correction against a more significant decline. However, if this continues, the correction may become the main trend.
What's even more interesting is that even if this happens, there won't be any additional reasons for the British pound to rise. The most important fundamental factor, namely the interest rates of the Bank of England and the Federal Reserve, will remain unchanged. The Bank of England may start monetary policy easing a bit later than the Fed, but in the end, it will reduce the rate just like the American regulator. Also, pay attention to the obvious divergence in the CCI indicator. Each subsequent indicator peak is lower than the previous one, with at least three such peaks. On the other hand, the corresponding price highs are each higher than the previous one. So, in addition to strong overbought conditions, we also have a triple "bearish" divergence.
What interesting events are expected next week that could change the market sentiment? If we answer this question very briefly, then nothing. Ordinary reports or speeches are unlikely to change the current "super bullish" market sentiment to "bearish." This could happen unexpectedly and without being linked to any significant event. Nevertheless, let's go through the most important publications and speeches.
This week, we will see the unemployment rate, wage levels, changes in unemployment claims, the Consumer Price Index, and retail sales in the UK. Naturally, only inflation can influence the pair's current illogical trend. Inflation in the UK may decrease and reach 3.7-3.8% by the end of December. The slowdown is expected to be slight, but it is still slow, which means the Bank of England will have slightly fewer reasons to keep the rate at its maximum level.
Of course, inflation is still low enough to talk about easing, but no one expects a rate cut from the British regulator soon. In the United States this week, there will be retail sales, industrial production, construction and real estate data, unemployment claims, and the University of Michigan's Consumer Sentiment Index. All these reports are secondary. There may be a reaction to them, but it will be localized.
Trading long at this point is risky, but selling the pair without strong sell signals is also not advisable. If the price remains below the 1.2760 level in the 24-hour timeframe, a sharp decline in the pound could start at any moment. This is the point to consider when making trading decisions.

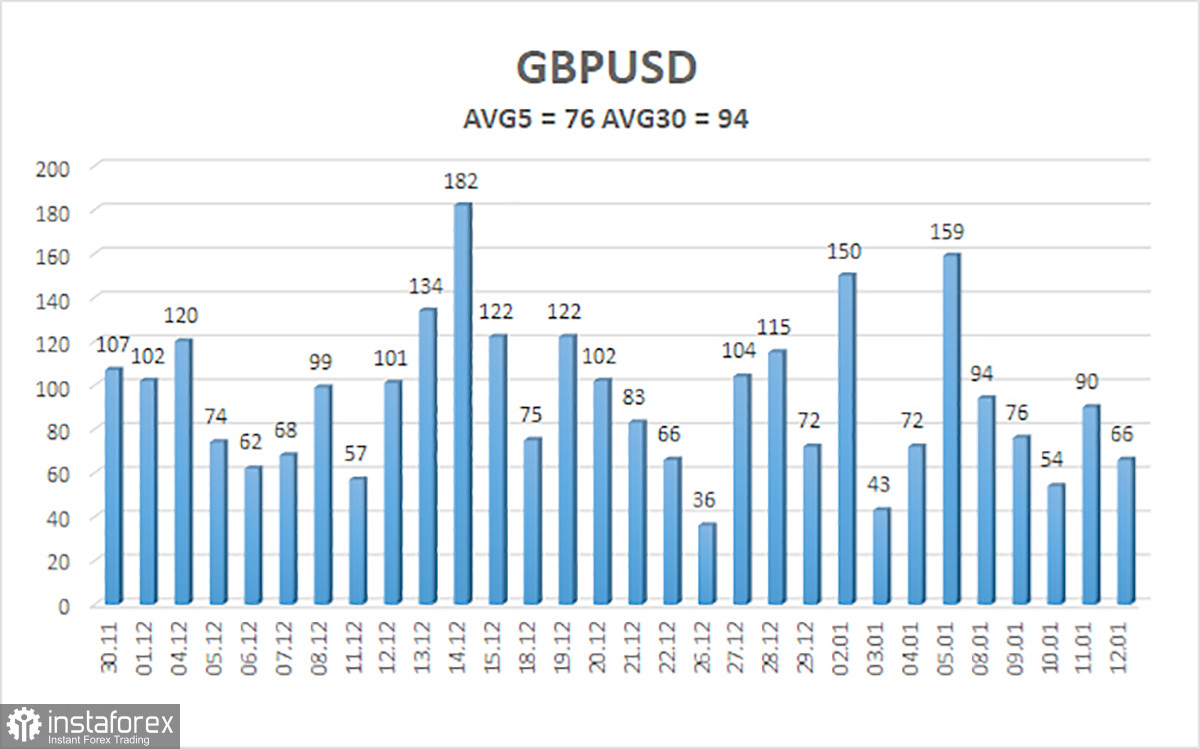
The average volatility of the GBP/USD pair over the last 5 trading days is 76 points. For the pound/dollar pair, this value is considered "average." Therefore, on Monday, January 15, we expect movement within the range limited by the levels of 1.2671 and 1.2823. A downward reversal of the Heiken Ashi indicator indicates a new attempt to start a downtrend.
Nearest support levels:
S1 – 1.2726
S2 – 1.2695
S3 – 1.2665
Nearest resistance levels:
R1 – 1.2756
R2 – 1.2787
R3 – 1.2817
Explanations for the illustrations:
Linear regression channels – help determine the current trend. If both point in the same direction, the trend is currently strong.
Moving average line (settings 20,0, smoothed) – determines the short-term trend and the direction in which trading should be conducted.
Murray levels – target levels for movements and corrections.
Volatility levels (red lines) – the probable price channel the pair will trade in the coming day, based on current volatility indicators.
CCI indicator – its entry into the overbought area (above +250) or oversold area (below -250) indicates an impending trend reversal in the opposite direction.
 English
 Русский
 Bahasa Indonesia
 Bahasa Malay
 ไทย
ไทย Español
 Deutsch
 Български
 Français
 Tiếng Việt
 中文
中文 বাংলা
বাংলা हिन्दी
 Čeština
 Українська
 Română

