EUR/USD

Higher Timeframes
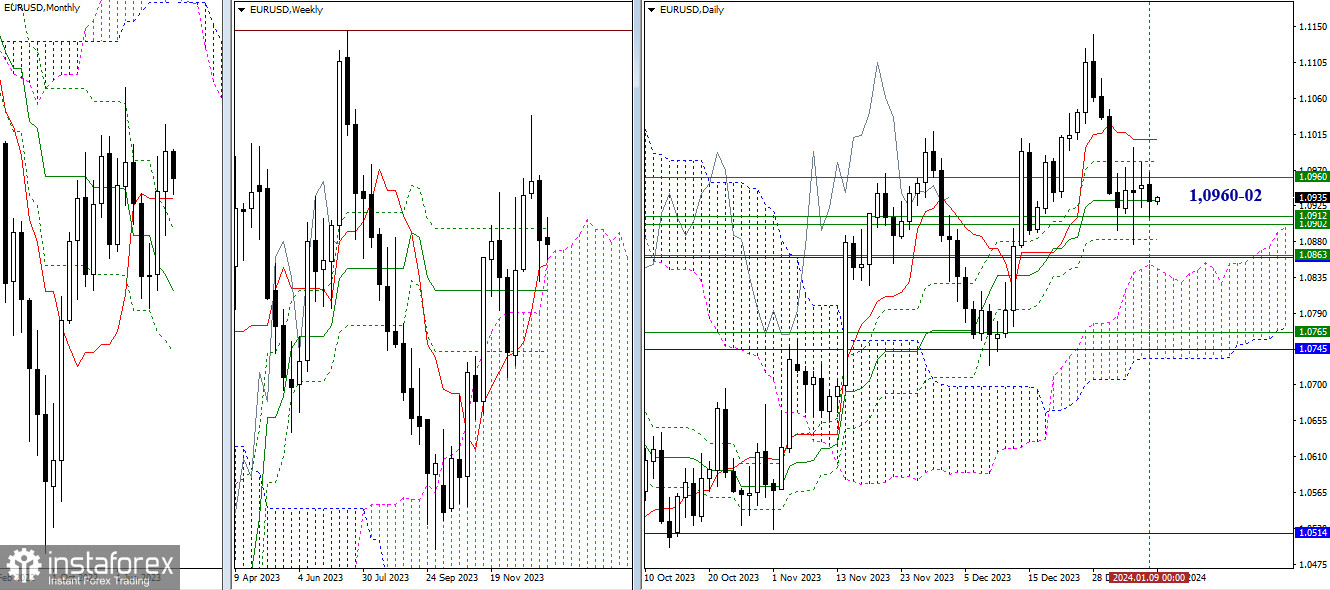
The consolidation continues as the past working day again brought no significant changes. The pair continues to trade within the range and influence of several levels from the daily (1.1008 - 1.0981 - 1.0932 - 1.0883) and weekly (1.0960 - 1.0912 - 1.0902) timeframes. When exiting this zone, bearish players will encounter a strong barrier at 1.0862 (monthly short-term trend + weekly medium-term trend), while bullish players will need to exit the daily correction zone and renew the December high at 1.1140.

H4 - H1
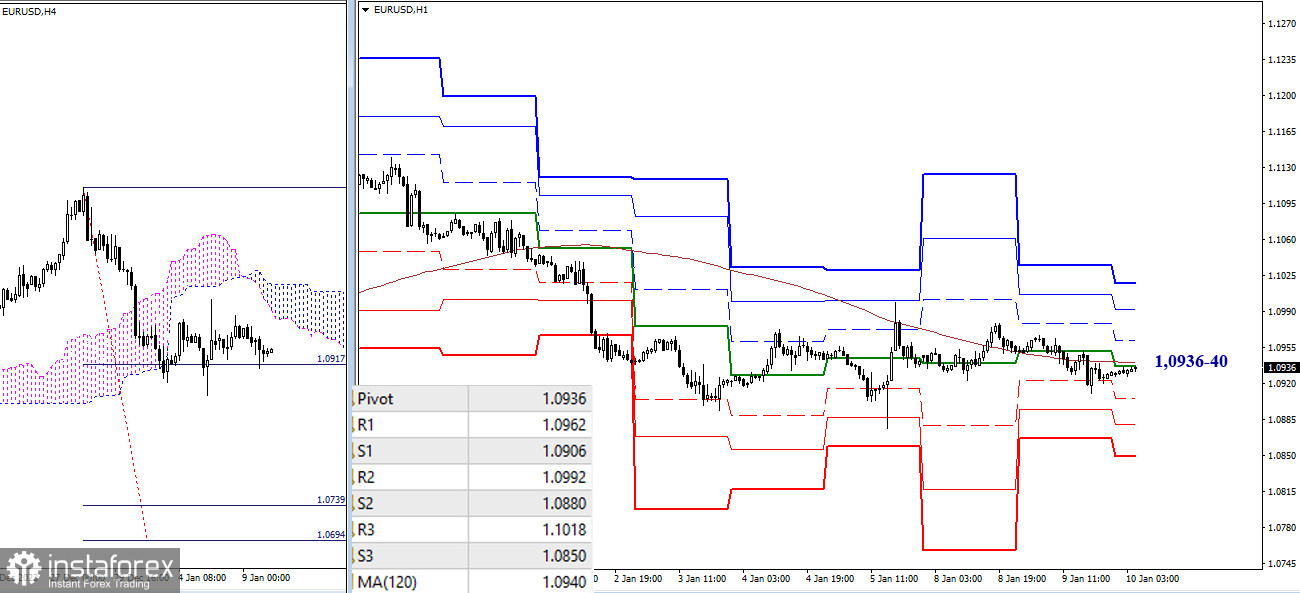
On the lower timeframes, sideways movement persists. Uncertainty is currently supported and confirmed by trading within the influence of key levels, which are now converging in the region of 1.0936-40 (central pivot point + weekly long-term trend). If the market shows activity today, intraday targets based on classic pivot points may be achieved. With increased bullish activity, attention will shift to resistances (1.0962 - 1.0992 - 1.1018), and in the case of a decrease, bears will focus on breaking through supports (1.0906 - 1.0880 - 1.0850).
***
GBP/USD

Higher timeframes
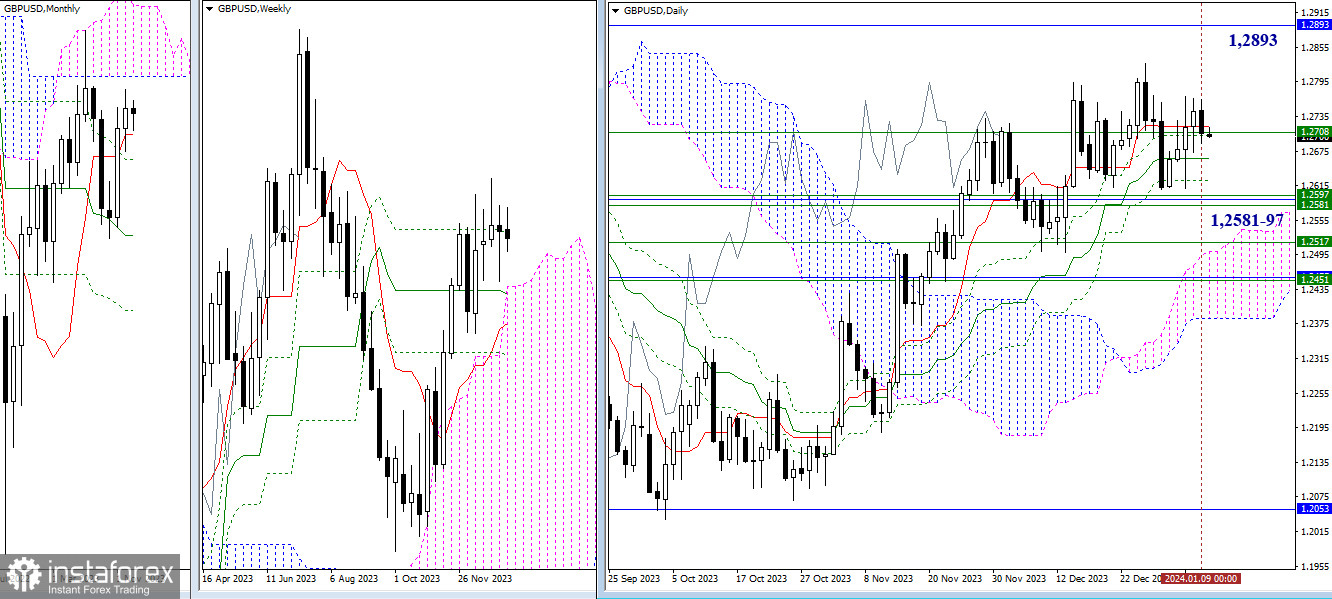
Bullish players clearly lack the strength to continue the upward movement. The opponent is not idle and can seize the initiative. To do this, they need to get rid of the attraction of the daily Ichimoku cross (1.2717 - 1.2701 - 1.2662 - 1.2624), reinforced by the weekly level (1.2708), and start testing the accumulation of supports in the region of 1.2581-97 (monthly short-term trend + weekly levels). To develop bullish sentiments, bulls need to break out of consolidation, renew the December high (1.2826), and aim for the monthly cloud (1.2893).

H4 - H1
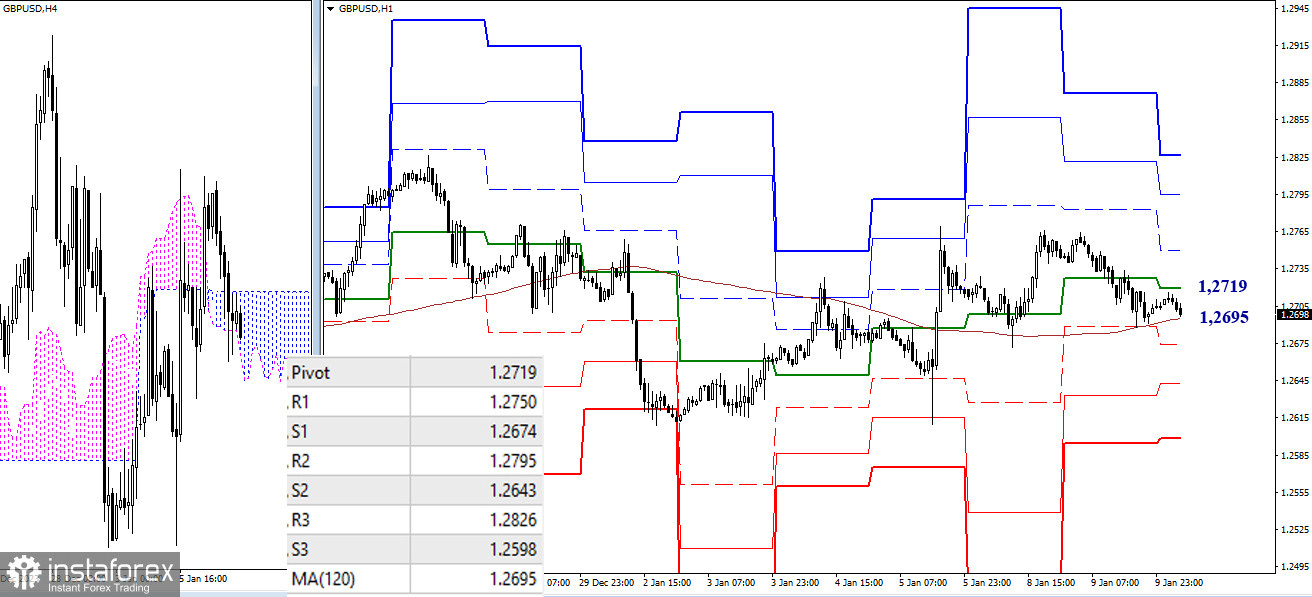
On the lower timeframes, bulls failed to continue the ascent, and the market, entering the correction zone, descended to the weekly long-term trend (1.2695). The trend serves as a kind of "watershed," and having a trend in most cases provides an advantage and opportunities for development. If bearish sentiments develop today, intraday targets may involve 1.2674 - 1.2643 - 1.2598 (support levels of classic pivot points). If bulls take the initiative, attention will be directed towards 1.2750 - 1.2795 - 1.2826 (resistance levels of classic pivot points).
***
The technical analysis of the situation uses:
Higher timeframes - Ichimoku Kinko Hyo (9.26.52) + Fibonacci Kijun levels
Lower timeframes - H1 - Pivot Points (classic) + Moving Average 120 (weekly long-term trend)
 English
 Русский
 Bahasa Indonesia
 Bahasa Malay
 ไทย
ไทย Español
 Deutsch
 Български
 Français
 Tiếng Việt
 中文
中文 বাংলা
বাংলা हिन्दी
 Čeština
 Українська
 Română

