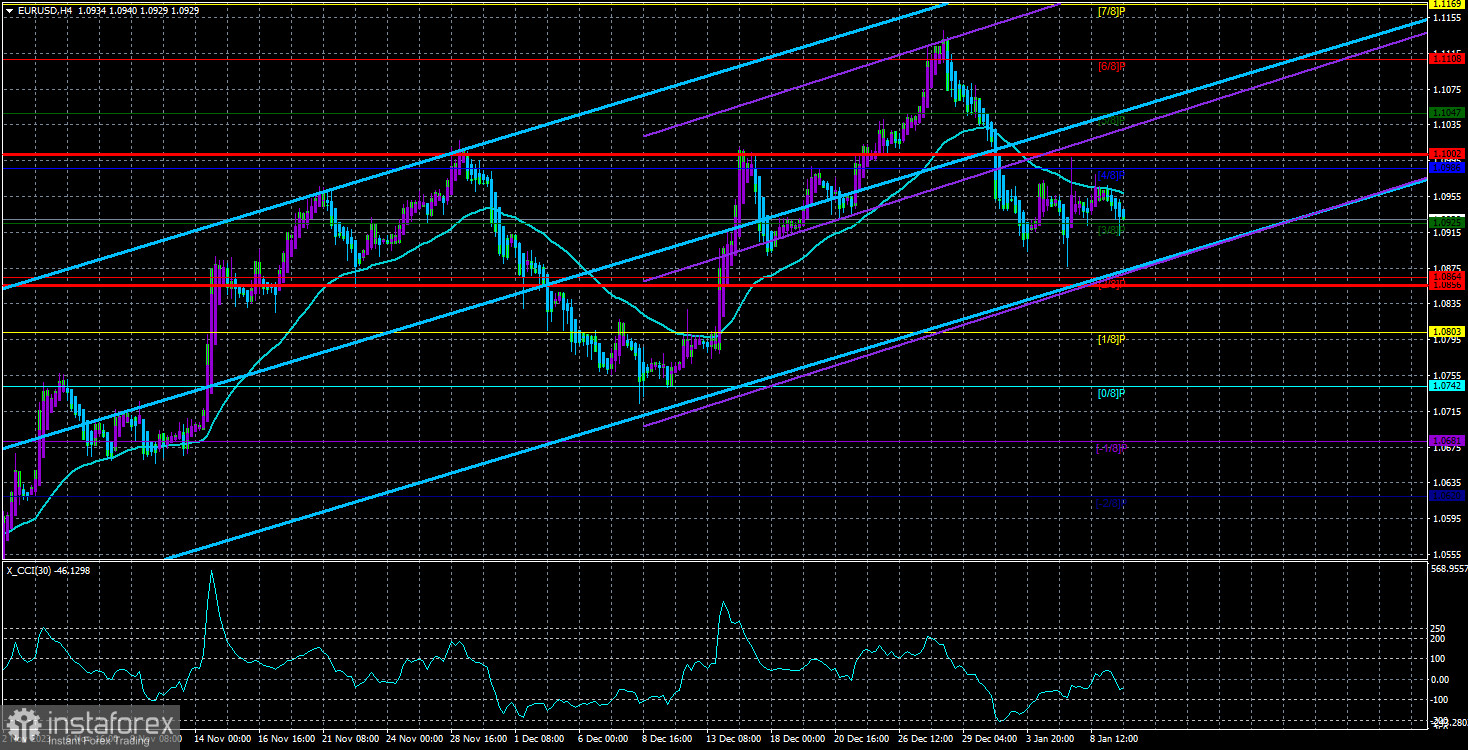
The currency pair EUR/USD continues to trade close to the moving average line, or, to be more precise, below it. Even if it moves above it soon, it won't change much. In brief, let's recap the current situation. The pair rose for three months, then started a downward correction, and for the past few days, it has essentially been stagnant.
However, such behavior of the pair is not surprising. There needs to be more fundamental and macroeconomic background in the first three days of the current week, and the remaining two days will have rather scarce data. The only important report to consider is the US inflation, which will be released on Thursday. Everything else is secondary data. If there are no news, reports, or events, sluggish trading is a natural development.
It's worth mentioning fundamental events separately. Two months ago, we began to say that speeches by representatives of the Federal Reserve (Fed) and the European Central Bank (ECB) were starting to lose their value in the eyes of traders. While market participants eagerly awaited every speech from any central bank representative in the past, hoping for new hints regarding the ultimate size of the key interest rate, now it's clear to everyone: rates have reached their limit and will only go lower.
One might assume that the market is waiting for hints about the timing of the first rate cut in the European Union or the US, but that's not the case. The dollar has been declining steadily for the past three months, indicating that the market has already decided who, when, and how much it will cut rates in 2024. Traders still believe that the Fed will start the easing cycle first, followed by the ECB, and the Bank of England will be last. Thus, the dollar remains under market pressure based on traders' rate expectations. Whether these expectations are correct or not doesn't matter.
Yesterday, Raphael Bostic, the President of the Federal Reserve Bank of Atlanta, delivered a speech. Some experts immediately made a big deal out of it, thinking that Bostic's speech triggered another drop in the dollar, even though it lost only minimal positions that day, which could be attributed to market noise. However, in his speech, Bostic noted good progress in fighting inflation and emphasized that the Fed remains on course to achieve its 2% target. Mr. Bostic also mentioned that inflation in America is declining faster than he expected. The head of the Atlanta Fed did not mention a possible rate cut and, if anything, hinted at maintaining the rate at its current level to ensure a further slowdown in the Consumer Price Index.
In reality, inflation in the United States has been rising more than falling in recent months. Fed representatives do not evaluate this indicator on a month-to-month basis. They consider the overall trend and median values. According to these parameters, inflation is decreasing, and that's indisputable. However, it is still above 3%, so it is too early to discuss a key rate cut. The fact that Mr. Bostic did not mention impending easing may indicate that the view that the Fed will start easing in March is premature. The December inflation report, due this week, could show another acceleration.
Therefore, we still believe that the euro is too expensive and the dollar is too cheap, and we expect a drop in the EUR/USD pair.

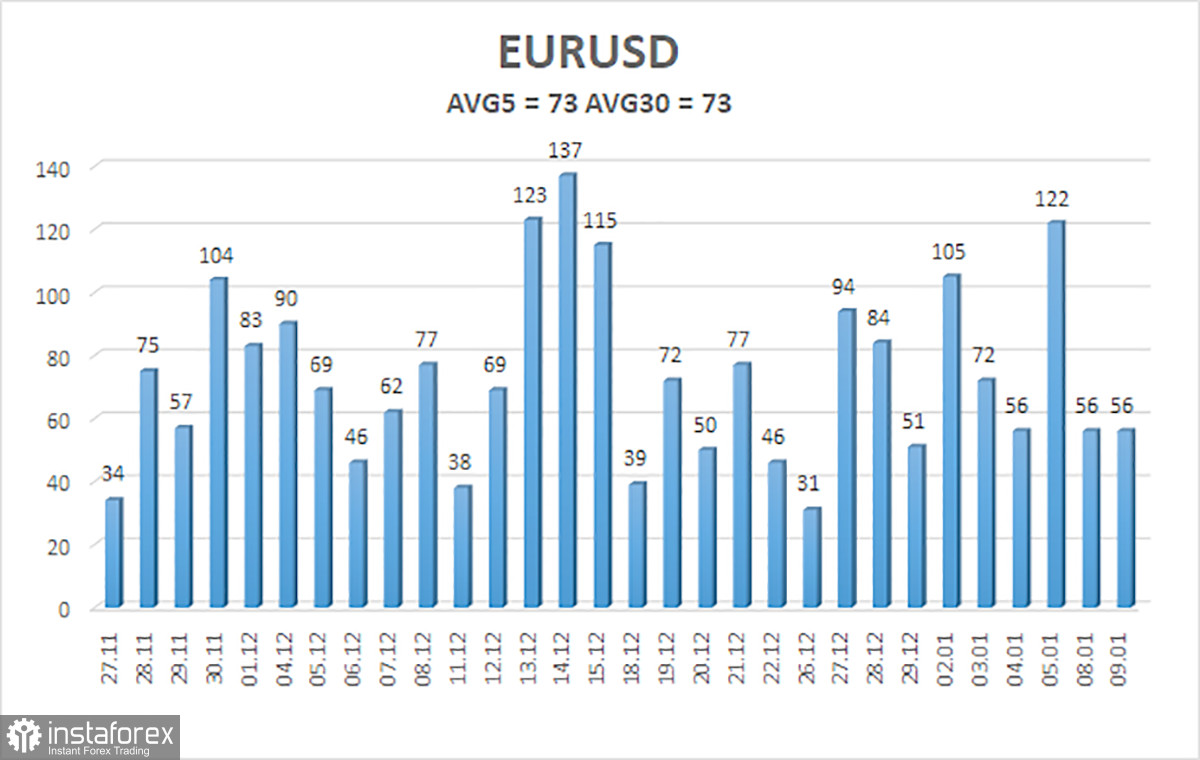
The average volatility of the EUR/USD currency pair over the last five trading days as of January 10th is 73 points, characterized as "average." Therefore, we expect movement between levels 1.0856 and 1.1002 on Wednesday. An upward reversal of the Heiken Ashi indicator will indicate a new attempt to establish itself above the moving average and change the trend.
Nearest support levels:
S1 - 1.0925
S2 - 1.0864
S3 - 1.0803
Nearest resistance levels:
R1 - 1.0986
R2 - 1.1047
R3 - 1.1108
Explanations for the illustrations:
Linear regression channels - help determine the current trend. If both point in the same direction, the trend is strong right now.
Moving average line (settings 20,0, smoothed) - determines the short-term trend and the direction in which trading should be conducted.
Murray levels - target levels for movements and corrections.
Volatility levels (red lines) - the probable price channel in which the pair will move the next day, based on current volatility indicators.
CCI indicator - its entry into the oversold area (below -250) or overbought area (above +250) indicates an approaching trend reversal in the opposite direction.
 English
 Русский
 Bahasa Indonesia
 Bahasa Malay
 ไทย
ไทย Español
 Deutsch
 Български
 Français
 Tiếng Việt
 中文
中文 বাংলা
বাংলা हिन्दी
 Čeština
 Українська
 Română

