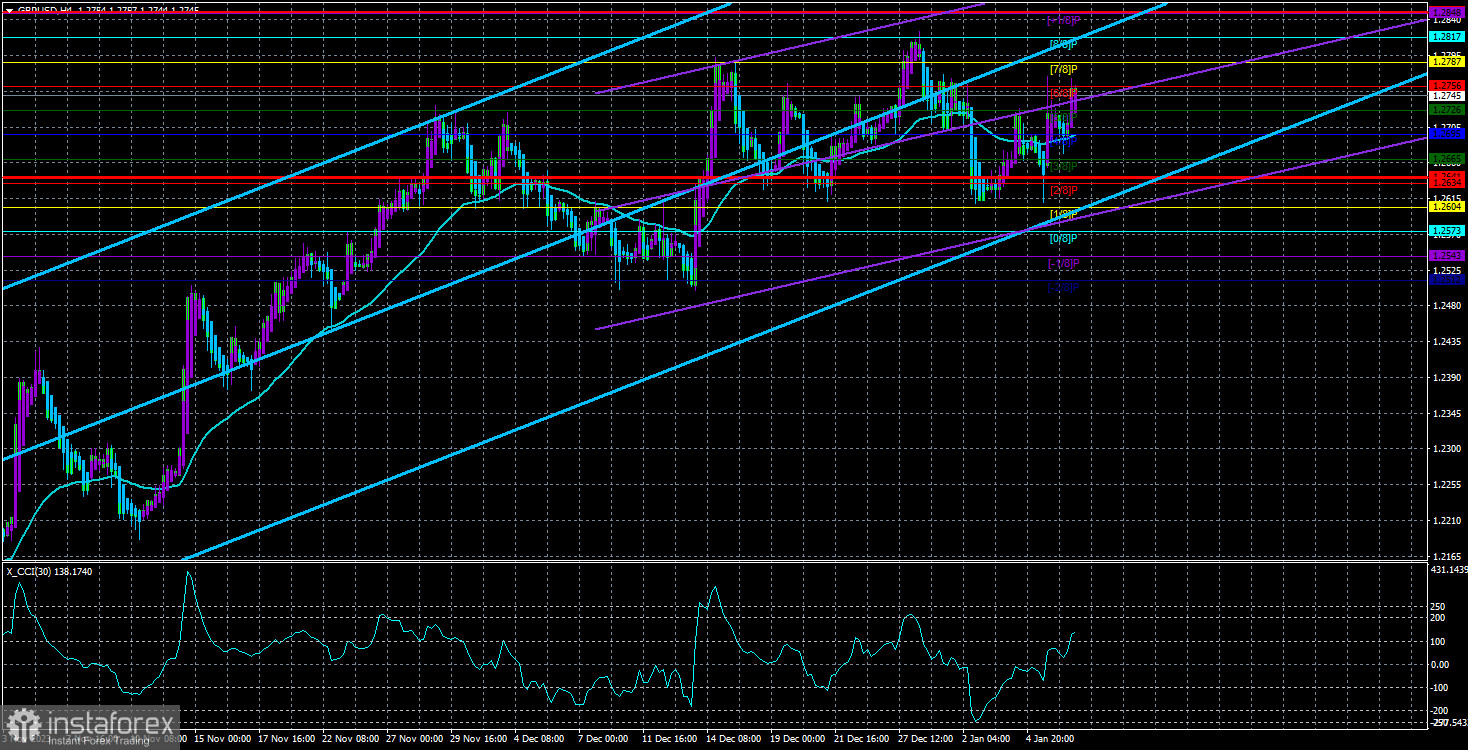
The GBP/USD currency pair traded fairly calmly on Monday, positioning itself slightly above the moving average line. We have already described the entire technical picture over the weekend, but let's briefly recap. First, a "head and shoulders" pattern may form on the pound, clearly visible in the 4-hour timeframe. Second, the pair still needs to overcome the 1.2620 level four or five times already. Third, the market still refuses to sell the British currency. Fourth, the fundamental and macroeconomic background plays almost no role; the market interprets it as it pleases.
Hence, we have illogical movements that are extremely difficult to predict. On Friday, the dollar could have shown good growth, but for some reason, the market deemed reports from two and three months ago (non-farm payrolls) more important than December's. Also, the market was not interested in the unemployment report, which was stronger than expected. Still, it was very interested in the ISM business activity index in the service sector, which was weaker than forecasts. Thus, nothing changes in the market: all positive news for the dollar is ignored, while the negative news is heavily worked on.
Nevertheless, it is still worth briefly considering the upcoming events. So, in the UK this week, GDP and industrial production data will be published. Both will come out on Friday, and the calendar will be empty during the week. The GDP report is monthly, so it will have little impact on market sentiment. The industrial production report (unless there is a significant deviation) is secondary, so we do not expect a market reaction to it.
In the United States, the situation will be slightly more interesting. We will only see significant publications on Thursday. On Thursday, the December inflation report will be published, which may and should once again demonstrate that all market expectations of the Fed rate cut in March are just fantasy. The Consumer Price Index may accelerate from 3.1% to 3.2-3.3%, and whether the Fed will start easing after such a reading at the next meeting is unclear.
Rising inflation is a "bullish" factor for the American currency, but we will not be surprised if the market ignores it, as many others have been before. Nothing interesting will happen in the United States on Friday.
In summary, we have one important report this week and two secondary reports, and that's it. We still expect a strong rise for the American currency because we don't understand what it should continue to fall due to. We need to understand why the pound and the euro should continue strengthening. However, the market has its view of what's happening, so it's best to rely on the technical picture. For the pound, it is ambiguous, as any consolidation below the moving average does not lead to the start of a downtrend. Even though it is illogical, the rock-solid level of 1.2620 keeps the pound from falling. But on the 24-hour timeframe, the pound cannot break through the 1.2763 level (61.8% Fibonacci retracement). Therefore, the pair remains trapped in a sideways channel. The direction in which it will break through its boundaries is where the movement will likely continue.

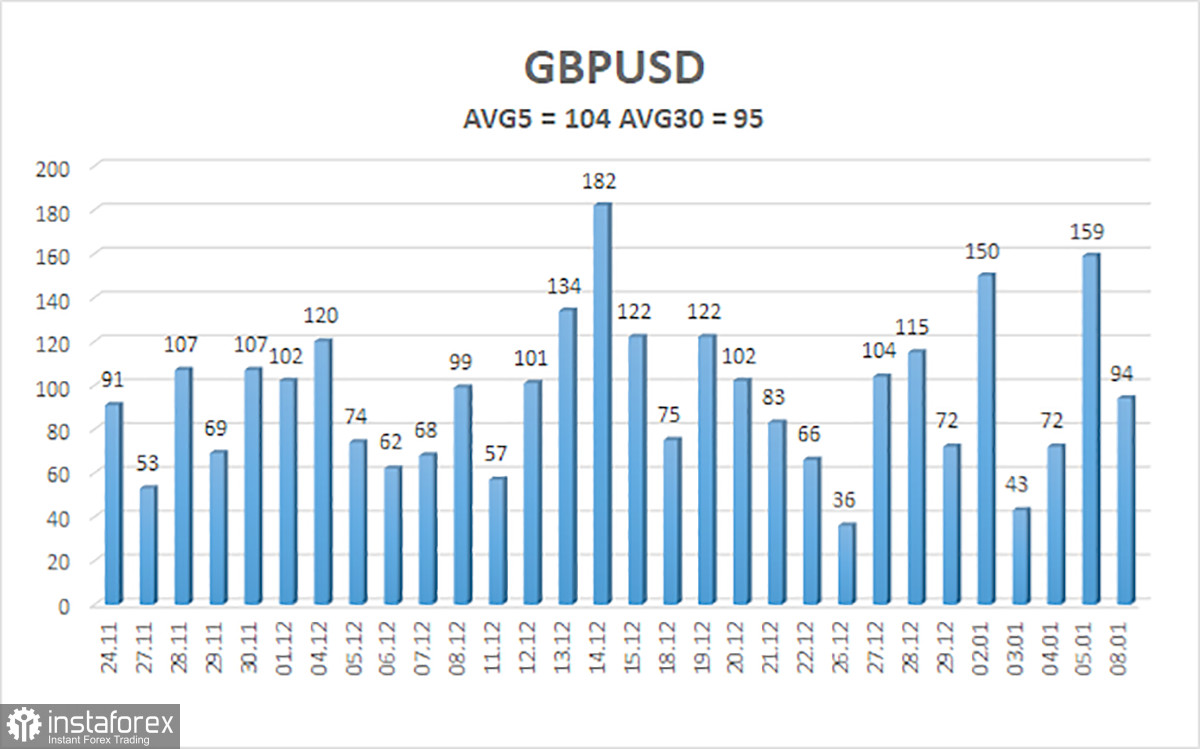
The average volatility of the GBP/USD pair over the last five trading days as of January 9th is 104 points. For the pound/dollar pair, this value is considered "average." Thus, on Tuesday, January 9th, we expect movement between 1.2641 and 1.2849. A downward reversal of the Heiken Ashi indicator will indicate a new attempt to start a downward trend.
Nearest support levels:
S1 - 1.2726
S2 - 1.2695
S3 - 1.2665
Nearest resistance levels:
R1 - 1.2756
R2 - 1.2787
R3 - 1.2817
Explanations for the illustrations:
Linear regression channels - help determine the current trend. If both are directed in the same direction, the trend is strong.
Moving average line (settings 20,0, smoothed) - determines the short-term trend and direction in which trading should be conducted.
Murray levels - target levels for movements and corrections.
Volatility levels (red lines) - the likely price channel the pair will spend the next day based on current volatility indicators.
CCI indicator - its entry into oversold territory (below -250) or overbought territory (above +250) indicates an approaching trend reversal in the opposite direction.
 English
 Русский
 Bahasa Indonesia
 Bahasa Malay
 ไทย
ไทย Español
 Deutsch
 Български
 Français
 Tiếng Việt
 中文
中文 বাংলা
বাংলা हिन्दी
 Čeština
 Українська
 Română

