The currency pair EUR/USD traded impulsively on Friday, driven by emotions. This is unsurprising, as there were several macroeconomic events, and almost all were important. Thus, during the day, we witnessed both the rise and fall of the pair. However, we cannot conclude that the movements were logical, just as the market's reaction to another batch of economic statistics.
This article will discuss the clarity and ambiguity of the published information and the market's interpretation of the information received. After all, why do traders study specific data? To forecast the movement of a pair or instrument and make a profit later. However, the problem is not finding which side a particular report or event supports. The problem is how the majority of market participants interpret a particular event. After all, the market moves the price, not the reports or events.
Therefore, the question of interpretation holds significant importance. Let's revisit the Friday reports. Among them, the nonfarm payrolls report stands out as the most crucial. It exceeded expectations for December by 50 thousand. Does this report favor the dollar? Yes, it does. However, there's a twist - values for November and October were simultaneously revised downward. Do these revisions favor the dollar? Not really. So, from a single report, we have obtained two negative indicators and one positive. The challenge lies in determining which one carries more weight in the eyes of the market.
The unemployment report pleasantly surprised by outperforming expectations, but the ISM index disappointed. Additionally, the unemployment rate remained stagnant compared to November, while the ISM index dipped slightly but remained above the critical level of 50.0, which is considered a positive reading. How should we interpret this data? It might be more prudent to ask how to gauge the collective market interpretation. Two out of three of the most pivotal reports on Friday exceeded expectations, but three out of five values fell short.
In the ever-changing world of finance, one thing remains constant: certainty about the direction of price movement is a rare commodity, even when the macroeconomic and fundamental backdrop appears crystal clear. For weeks now, the United States has enjoyed a more favorable macroeconomic environment compared to the European Union and the United Kingdom. However, the Fed may not be in a rush to cut interest rates in March or January. In fact, the Fed might follow a similar rate-cutting path as the ECB and the Bank of England. Nevertheless, the market fervently embraces the dollar, hoping to witness something unique.
So, what can one do when faced with such market behavior? The solution lies in technical analysis, which currently fails to provide convincing reasons for anticipating a significant decline in the euro. Yes, on the 4-hour chart, there's room for the euro to weaken, but on the 24-hour chart, it has yet to breach the significant Kijun-sen line. This suggests the possibility of a bounce from that level, potentially reigniting the upward trend that has been forming over several months.
And it doesn't matter that this trend is a correction. If the market is ready to keep buying, the pair will continue rising. Thus, the conclusion can be drawn as follows: the fundamental and macroeconomic background only allows us to speculate on future developments. But it will not tell us when the trend will reverse or whether the price will move in the desired direction.
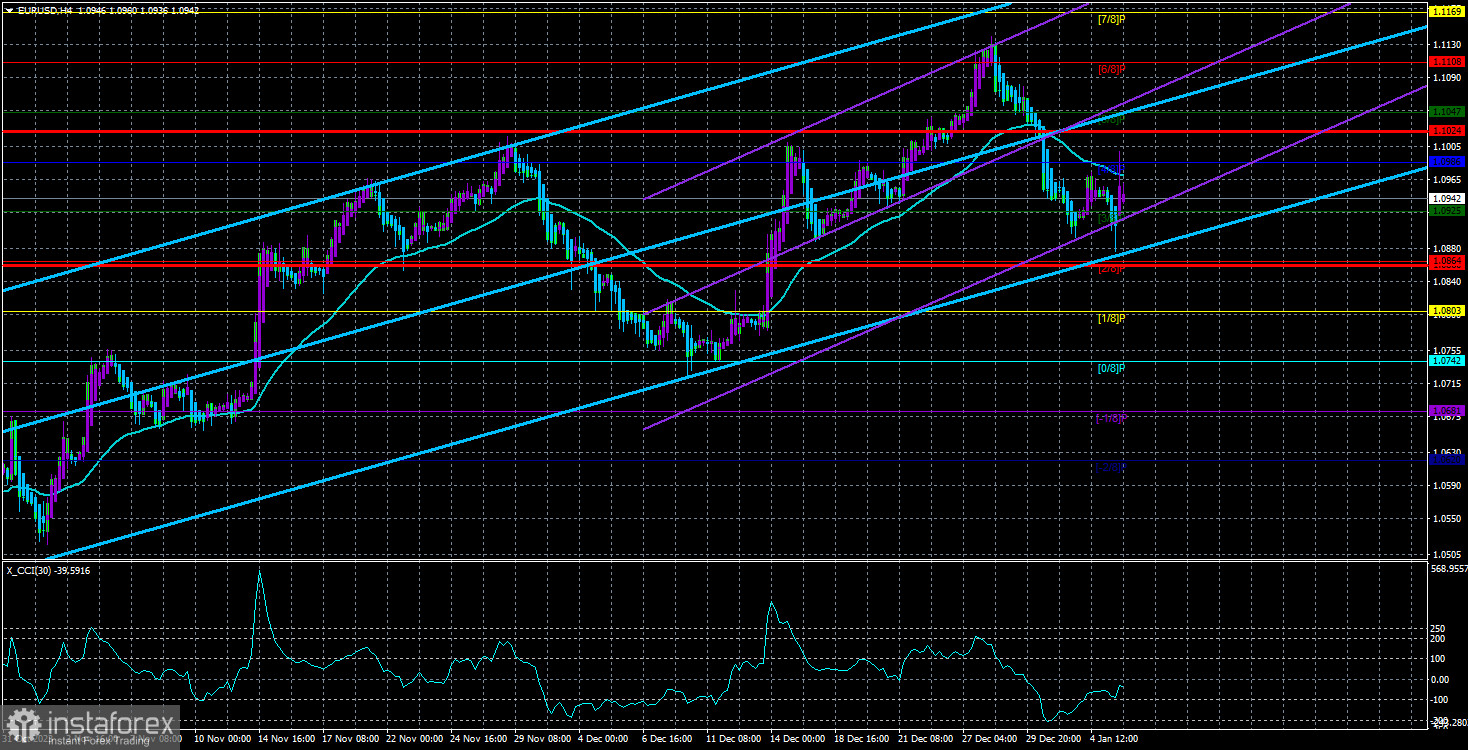
Technical analysis visualizes what is happening in the market, reflecting market sentiment. Currently, on the 4-hour timeframe, it is "bearish," judging by the linear regression channels, while on the 24-hour timeframe, it is "bullish," according to the Ichimoku indicator.

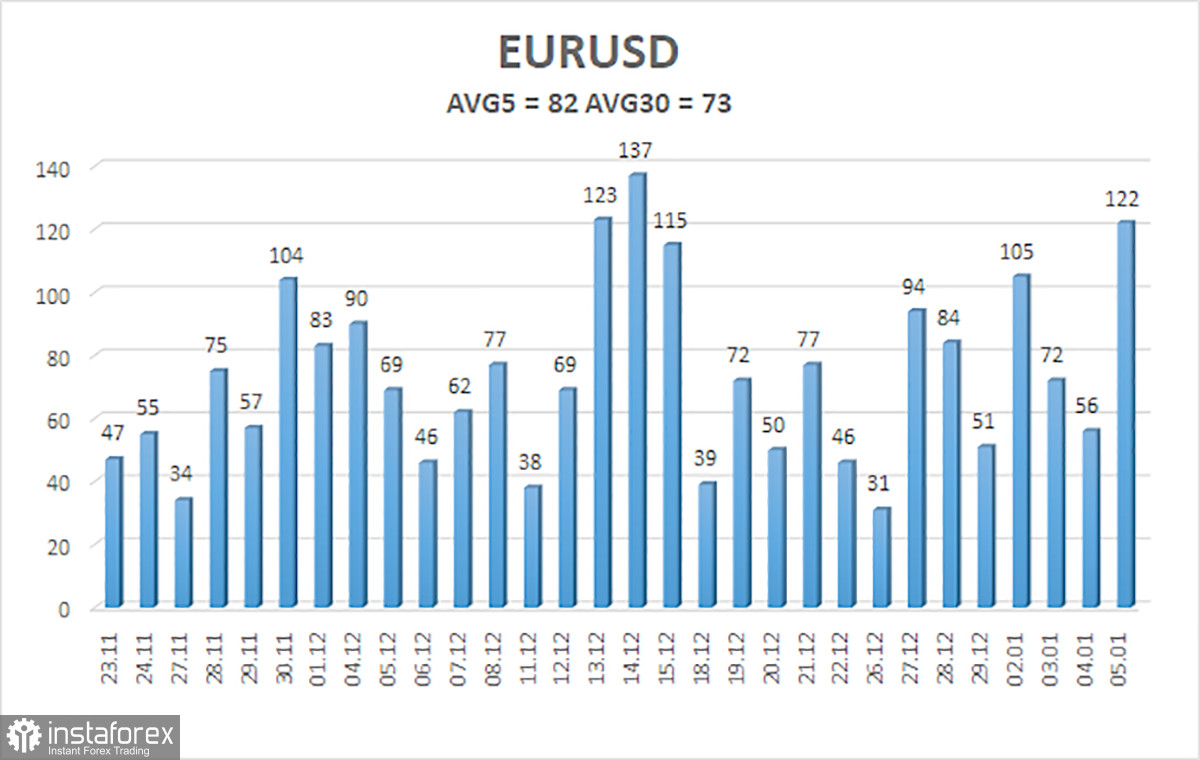
The average volatility of the EUR/USD currency pair over the past five trading days as of January 8th is 82 points and is characterized as "average." Thus, we expect movement in the pair between the levels of 1.0860 and 1.1024 on Monday. A downward reversal of the Heiken Ashi indicator will indicate a possible resumption of the downward movement.
Nearest support levels:
S1 - 1.0925
S2 - 1.0864
S3 - 1.0803
Nearest resistance levels:
R1 - 1.0986
R2 - 1.1047
R3 - 1.1108
Explanations for the illustrations:
Linear regression channels - help determine the current trend. If both channels point in the same direction, the trend is currently strong.
The moving average line (settings 20.0, smoothed) - determines the short-term trend and the direction in which trading should be conducted.
Murray levels - target levels for movements and corrections.
Volatility levels (red lines) - the probable price channel in which the pair will move the next day, based on current volatility indicators.
CCI indicator - its entry into the overbought area (above +250) or oversold area (below -250) indicates that a trend reversal in the opposite direction is approaching.
 English
 Русский
 Bahasa Indonesia
 Bahasa Malay
 ไทย
ไทย Español
 Deutsch
 Български
 Français
 Tiếng Việt
 中文
中文 বাংলা
বাংলা हिन्दी
 Čeština
 Українська
 Română

