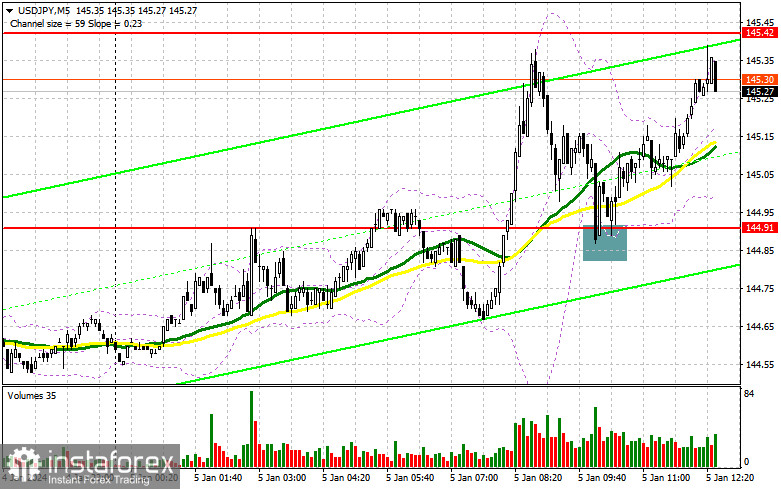
In my morning forecast, I highlighted the level of 144.91 and planned to make trading decisions based on it. Let's look at the 5-minute chart and analyze what happened there. The breakthrough and subsequent retest of 144.91 from above to below resulted in a good entry point for buying the pair, ultimately leading to an increase of more than 40 points. In the second half of the day, the technical picture was revised.

To open long positions on USD/JPY, the following is required:
More and more economists and major fund managers who closely monitor the Bank of Japan are in agreement that the end of negative interest rates, expected after the New Year holidays, will not happen. This is due to recent earthquakes in various regions of Japan and statements made by Governor Kazuo Ueda. It is now clear that the regulator is unlikely to abandon negative rates at its upcoming meeting on January 22–23, which increasingly prompts traders to buy the US dollar against the Japanese yen.
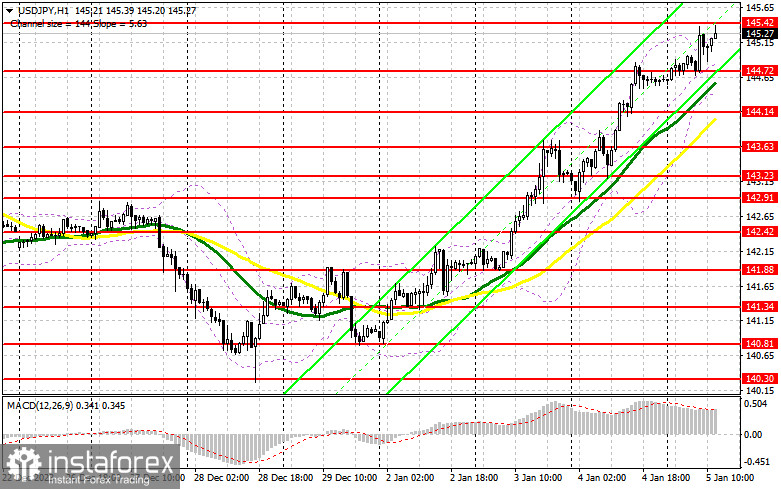
We are also awaiting important data on the US unemployment rate and changes in non-farm employment. Strong reports will lead to a new wave of pair growth, while weak indicators will allow for a small downward correction, which I plan to take advantage of, similar to yesterday. In the event of a bearish reaction to the data, I plan to open long positions only after a decline and the formation of a false breakout in the area of the new support at 144.72. This entry point may lead to a new attempt to push the pair higher, reaching a new high of 145.42. A breakout and a retest from above to below this range will result in buying with the prospect of a recovery towards 145.93. The ultimate target will be the area around 146.56, where I plan to make a profit. In the scenario of the pair's decline and the absence of activity at 144.72 from buyers, pressure on the dollar will return, leading to a larger downward movement. In this case, I will attempt to enter the market around 144.14, where moving averages are located. But only a false breakout will provide a point for opening long positions. I plan to buy USD/JPY immediately on a rebound only from the monthly low of 143.63, with a 30-35 point correction target within the day.
To open short positions on USD/JPY, the following is required:
Sellers attempted to do so in the first half of the day, but nothing came of it. The yen's weakness continues, and only weak US statistics can limit the pair's further upside potential. For this reason, I won't rush to sell against the bullish market. Only the formation of a false breakout in the new resistance area at 145.42 will confirm the presence of large players in the market and provide a selling entry point capable of pushing USD/JPY towards 144.72. A breakout and a retest from below to above this range will deal a more serious blow to buyer positions, leading to stop-loss triggering and opening the path to 144.14, where I expect significant buyers to emerge. The more distant target will be around 143.63, where I plan to make a profit. In the scenario of further USD/JPY growth and the absence of activity at 145.42 in the second half of the day, which is more likely, it's best to postpone selling until testing the next resistance at 145.93. In the absence of downward movement, I will also sell USD/JPY immediately on a rebound from 146.56, but only with the expectation of a pair correction down by 30-35 points within the day.

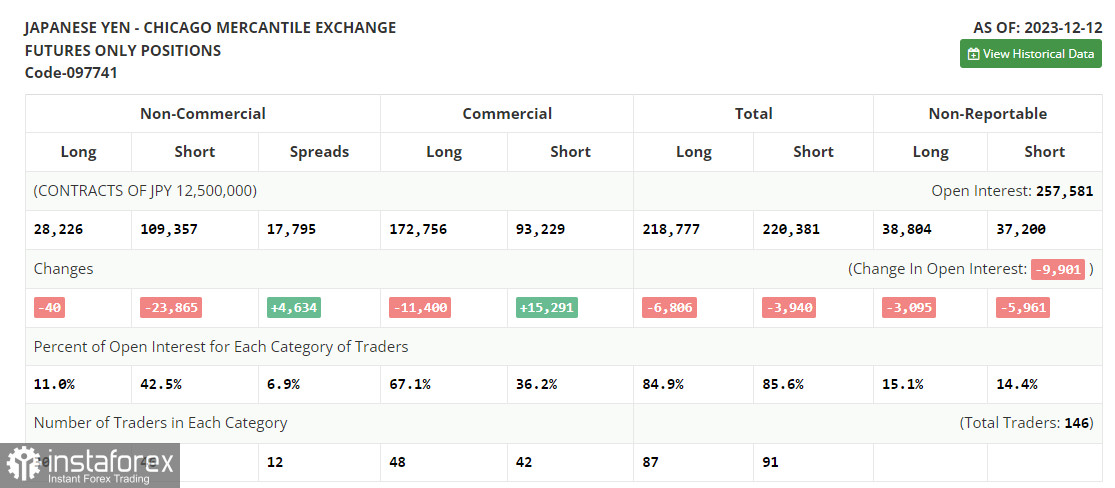
In the COT report (Commitment of Traders) for December 12th, there was a reduction in both long and short positions. The anticipated increase in interest rates by the Bank of Japan negatively affected yen sales, leading to a significant decrease in short positions. However, the lack of positive dynamics in long positions speaks for itself. Considering that the current report does not yet reflect the regulator's new position to maintain an extremely accommodative monetary policy, the most prudent decision would be not to pay attention to the current alignment of forces in this report. The Federal Reserve's soft stance will continue to exert pressure on the dollar in any case, so every time USD/JPY shows active growth, I advise opening short positions to continue the bearish trend in the pair. The latest COT report noted that long non-commercial positions decreased by 40 to 28,226, while short non-commercial positions decreased by a significant 23,865 to 109,357. As a result, the spread between long and short positions increased by 4,634.

Indicator signals:
Moving Averages:
Trading is above the 30 and 50-day moving averages, indicating further pair growth.
Note: The author determines the period and prices of moving averages on the H1 hourly chart and differs from the general definition of classic daily moving averages on the D1 daily chart.
Bollinger Bands:
In case of a decline, the lower boundary of the indicator, around 144.70, will act as support.
Indicator Descriptions:
- Moving Average (determines the current trend by smoothing volatility and noise). Period 50. Marked on the chart in yellow.
- Moving Average (determines the current trend by smoothing volatility and noise). Period 30. Marked on the chart in green.
- MACD Indicator (Moving Average Convergence/Divergence - convergence/divergence of moving averages). Fast EMA period 12. Slow EMA period 26. SMA period 9.
- Bollinger Bands. Period 20.
- Non-commercial traders - speculators, such as individual traders, hedge funds, and large institutions, use the futures market for speculative purposes and meet certain requirements.
- Long non-commercial positions represent the total long open positions of non-commercial traders.
- Short non-commercial positions represent the total short open positions of non-commercial traders.
- The total non-commercial net position is the difference between short and long non-commercial positions.
 English
 Русский
 Bahasa Indonesia
 Bahasa Malay
 ไทย
ไทย Español
 Deutsch
 Български
 Français
 Tiếng Việt
 中文
中文 বাংলা
বাংলা हिन्दी
 Čeština
 Українська
 Română

