 English
  Русский
 Bahasa Indonesia
 Bahasa Malay
 ไทย
ไทย Español
 Deutsch
 Български
 Français
 Tiếng Việt
 中文
中文 বাংলা
বাংলা हिन्दी
 Čeština
 Українська
 Română

Analyzing Thursday's trades:
EUR/USD on 30M chart
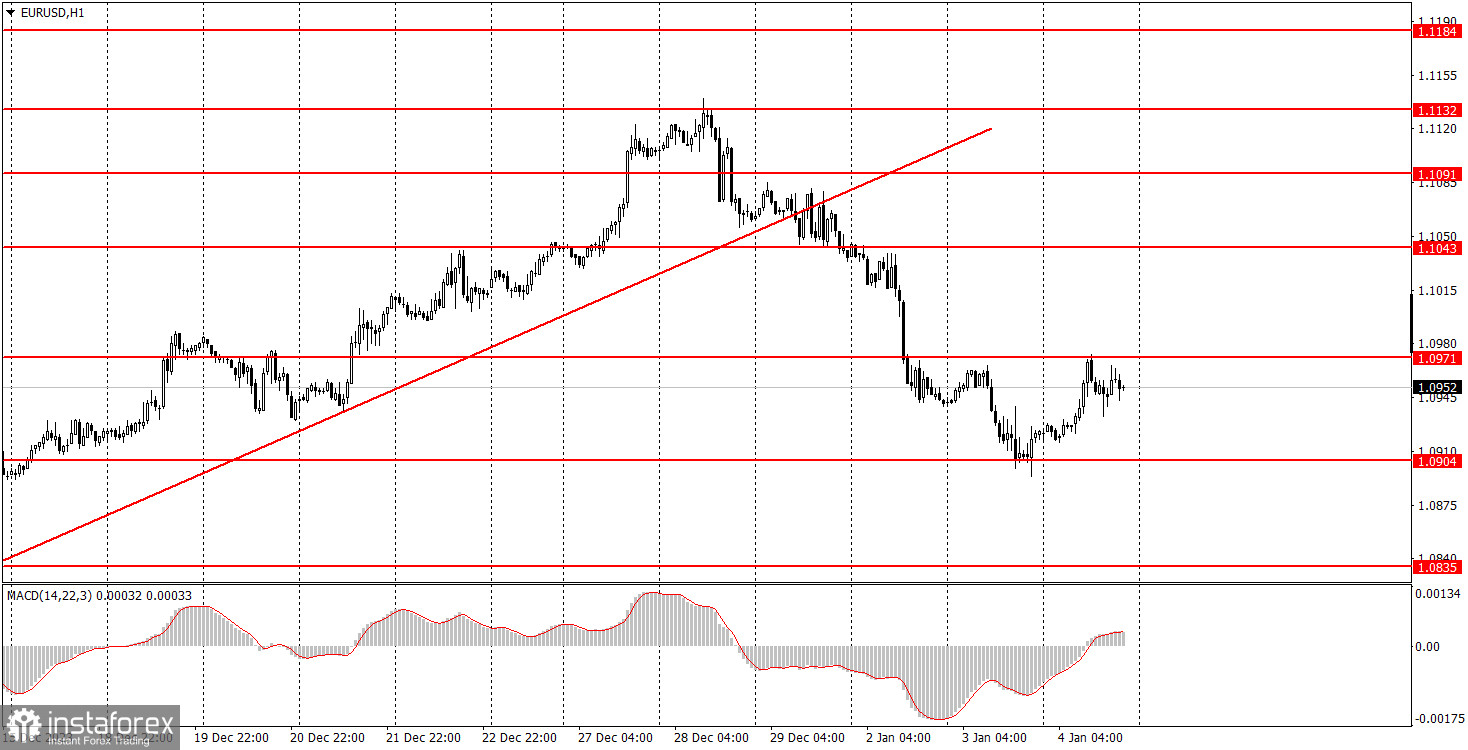
EUR/USD experienced a minor correction on Thursday. The level of 1.0904 was tested on Wednesday, and the price corrected to the level of 1.0971. From a technical perspective, both movements were nearly perfect. However, the pair's volatility was around 60 pips, which is relatively low. This means that there was no significant movement or strong correction. In principle, 60 pips is a normal level of volatility for the euro. The pair fell for four days, and it corrected slightly. Everything is in line with expectations.
Overall, we expect the pair to fall further, but we also acknowledge the possibility that the three-month uptrend may resume. The market is currently not inclined to buy the US dollar, regardless of the factors that might support it. The economic reports from Wednesday and Thursday had almost no impact on the pair's movement. This suggests that after a prolonged rise, we might have seen a downward correction, and once it ends, the uptrend could resume. In any case, breaking above new levels will be indicative of the ultimate direction.
EUR/USD on 5M chart
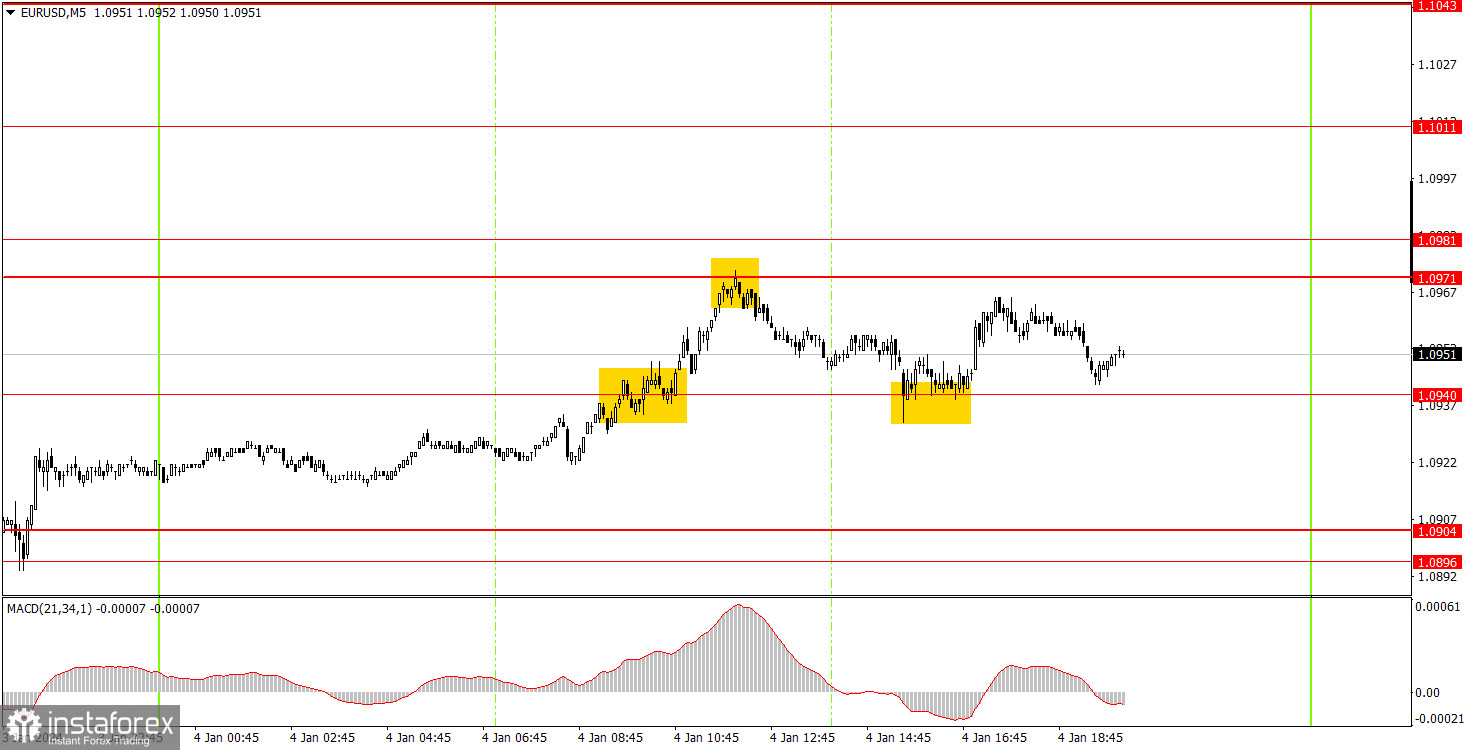
On the 5-minute chart, three trading signals were generated. First, the pair settled above the level of 1.0940, then rebounded from the level of 1.0971, and then again from 1.0940. Since the distance between these levels was only 31 pips, it was difficult to expect high profits from each trade. However, two out of three trades closed with a profit, while one (the last one) broke even at the Stop Loss. Overall, traders could gain a small profit.
Trading tips on Friday:
On the hourly chart, EUR/USD finally has a chance to form a downtrend. The US will release important reports that can still affect the dollar's exchange rate. Therefore, the pair could either show a significant growth or decline. To establish a downtrend line, we need a second reference point.
On Friday, we will start from the range of 1.0940-1.0971. The price has been moving between these levels all day, so a break above or below this range can help the market determine the pair's direction. However, you need to be cautious in the second half of the day, as the US will release very important reports.
The key levels on the 5M chart are 1.0733, 1.0767-1.0781, 1.0835, 1.0896-1.0904, 1.0940, 1.0971-1.0981, 1.1011, 1.1043, 1.1091, 1.1132-1.1145, 1.1184, 1.1241, 1,1279-1,1292. On Friday, the eurozone will release an inflation report for December, while the US will publish the NonFarm Payrolls, unemployment, and ISM Business Activity Index reports. All four reports are quite important, so there may be sharp reversals and increased volatility both in the morning and after lunch.
Basic trading rules:
1) Signal strength is determined by the time taken for its formation (either a bounce or level breach). A shorter formation time indicates a stronger signal.
2) If two or more trades around a certain level are initiated based on false signals, subsequent signals from that level should be disregarded.
3) In a flat market, any currency pair can produce multiple false signals or none at all. In any case, the flat trend is not the best condition for trading.
4) Trading activities are confined between the onset of the European session and mid-way through the U.S. session, post which all open trades should be manually closed.
5) On the 30-minute timeframe, trades based on MACD signals are only advisable amidst substantial volatility and an established trend, confirmed either by a trend line or trend channel.
6) If two levels lie closely together (ranging from 5 to 15 pips apart), they should be considered as a support or resistance zone.
How to read charts:
Support and Resistance price levels can serve as targets when buying or selling. You can place Take Profit levels near them.
Red lines represent channels or trend lines, depicting the current market trend and indicating the preferable trading direction.
The MACD(14,22,3) indicator, encompassing both the histogram and signal line, acts as an auxiliary tool and can also be used as a signal source.
Significant speeches and reports (always noted in the news calendar) can profoundly influence the price dynamics. Hence, trading during their release calls for heightened caution. It may be reasonable to exit the market to prevent abrupt price reversals against the prevailing trend.
Beginning traders should always remember that not every trade will yield profit. Establishing a clear strategy coupled with sound money management is the cornerstone of sustained trading success.