Analysis of EUR/USD 5M

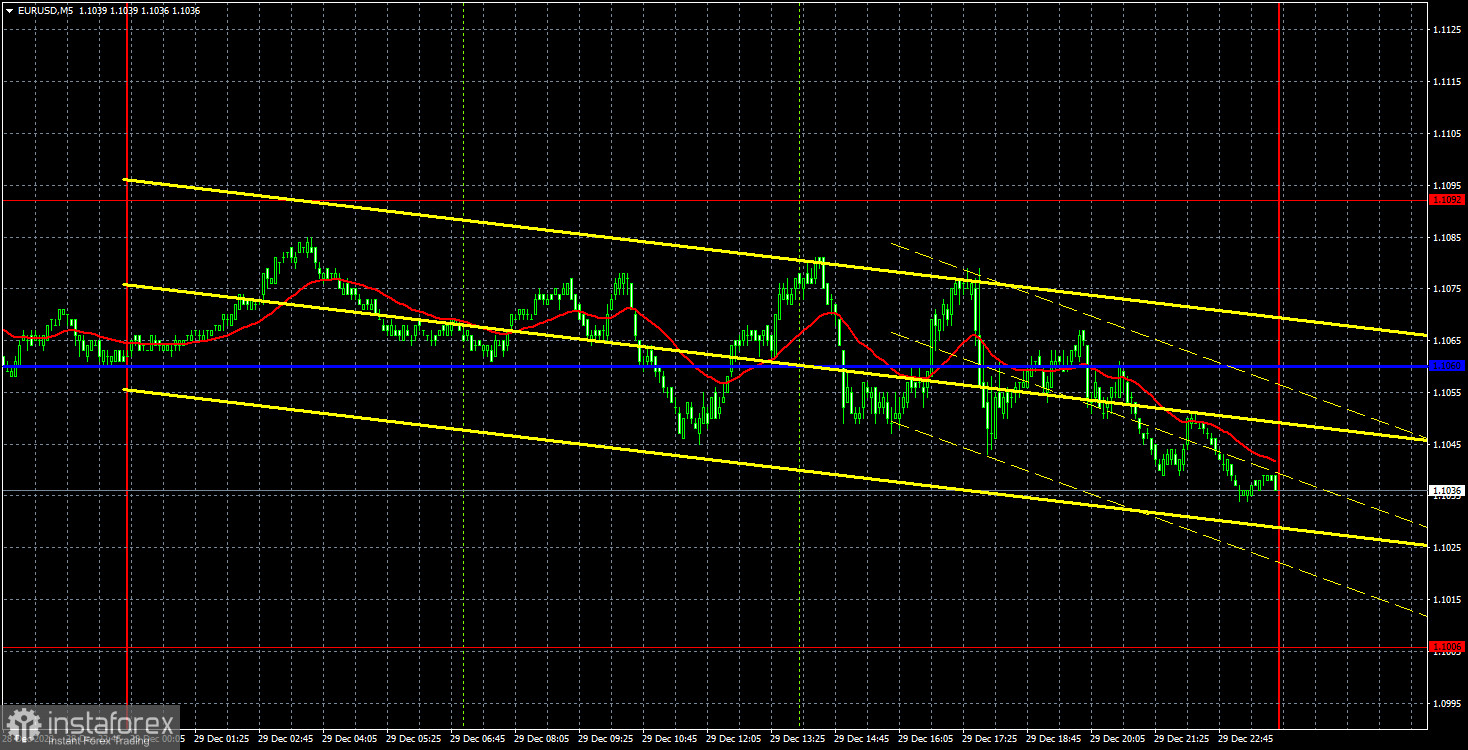
EUR/USD tried to extend its downward movement on Friday, but volatility was low, and it was the last working day of the year. Honestly, it's even hard for us to imagine what kind of trader would engage in intraday trading on December 29th. Not that it was strange or impractical, but it wasn't the most obvious choice. The last day was marked by completely chaotic movements. The pair constantly changed direction. Needless to say, there were no fundamental or macroeconomic events during the day.
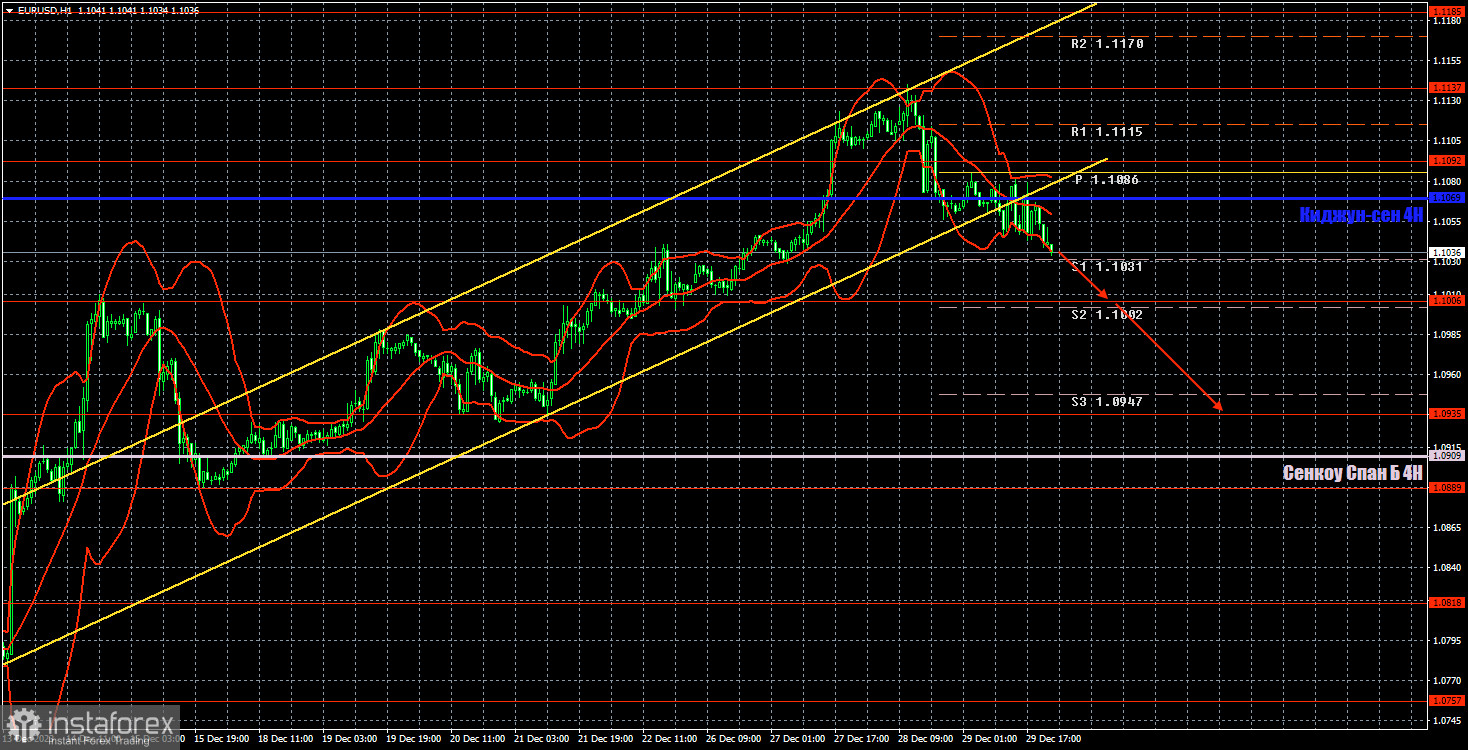
By the end of the day, the price closed below the critical line and the ascending channel. This signifies the first sign of a trend change to a downward one on the hourly time frame. Of course, this could just be another minor correction, after which the uptrend will resume. However, we would like to remind you that any strong trend starts with a small movement, and the euro has long lacked objective reasons for growth. Therefore, we believe that the US dollar has received another chance to form a strong uptrend.
The key factor is whether the U.S. data will spoil everything next week. In Europe and the UK, there will be few reports, and none of them will be significant. In the US, on the other hand, NonFarm Payrolls, unemployment data, ISM indices, and other important reports will be published. If the latest U.S. reports turn out to be disappointing again, it will be difficult for the US dollar to strengthen.
Speaking of trading signals, we didn't even mark their entry points. There were many signals, and all of them turned out to be false because the price constantly changed direction.
COT report:

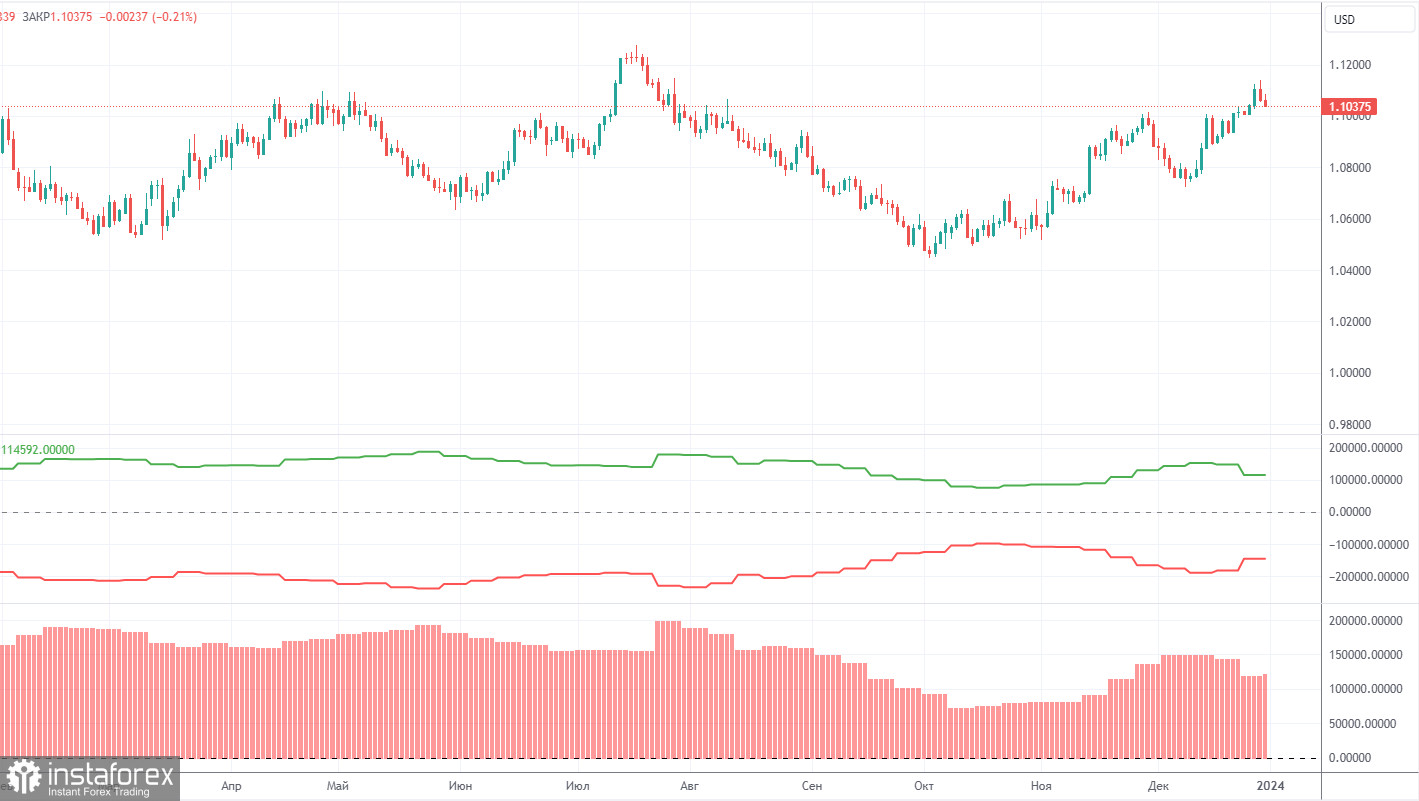
The latest COT report is dated December 26. In the first half of 2023, the net position of commercial traders hardly increased, but the euro remained relatively high during that period. Then, the euro and the net position both fell for several months, as we anticipated. However, in the last few weeks, both the euro and the net position have been rising. Therefore, we can conclude that the pair is correcting higher, but the corrections cannot last forever because they are just corrections.
We have previously noted that the red and green lines have moved significantly apart from each other, which often precedes the end of a trend. Currently, these lines are moving apart again. Therefore, we support the scenario where the euro should fall and the upward trend must end. During the last reporting week, the number of long positions for the non-commercial group increased by 3,100, while the number of short positions increased by 300. Consequently, the net position increased by 2,800. The number of buy contracts is still higher than the number of sell contracts among non-commercial traders by 118,000. The gap is significant, and even without COT reports, it is clear that the euro should continue to fall.
Analysis of EUR/USD 1H

On the 1-hour chart, EUR/USD has settled below the Kijun-sen line and the channel, giving us the opportunity to consider a new downtrend. The first target appears to be the Senkou Span B line. From our perspective, the US dollar has been oversold for a month and a half, and the next logical step is for it to move upwards (i.e., downwards for the EUR/USD pair).
Today, we consider it reasonable for you to sell while aiming for 1.1006 and 1.0935. Both targets are above the Senkou Span B line, which is the bulls' last chance to maintain the uptrend. However, even if the current movement is a correction, the price can easily drop to the level of 1.0909. On the other hand, we don't advise considering long positions at the moment. The euro has already been rising for too long for no valid reasons.
On January 2, we highlight the following levels for trading: 1.0658-1.0669, 1.0757, 1.0818, 1.0889, 1.0935, 1.1006, 1.1092, 1.1137, 1.1185, 1.1234, 1.1274, as well as the Senkou Span B (1.0909) and Kijun-sen (1.1069) lines. The Ichimoku indicator lines can shift during the day, so this should be taken into account when identifying trading signals. Don't forget to set a breakeven Stop Loss if the price has moved in the intended direction by 15 pips. This will protect against potential losses if the signal turns out to be false.
On Tuesday, second estimates of business activity indices in the manufacturing sectors for December will be published in the European Union, Germany, the United Kingdom, and the United States. These are relatively secondary data.
Description of the chart:
Support and resistance levels are thick red lines near which the trend may end. They do not provide trading signals;
The Kijun-sen and Senkou Span B lines are the lines of the Ichimoku indicator, plotted to the 1H timeframe from the 4H one. They provide trading signals;
Extreme levels are thin red lines from which the price bounced earlier. They provide trading signals;
Yellow lines are trend lines, trend channels, and any other technical patterns;
Indicator 1 on the COT charts is the net position size for each category of traders;
Indicator 2 on the COT charts is the net position size for the Non-commercial group.
 English
 Русский
 Bahasa Indonesia
 Bahasa Malay
 ไทย
ไทย Español
 Deutsch
 Български
 Français
 Tiếng Việt
 中文
中文 বাংলা
বাংলা हिन्दी
 Čeština
 Українська
 Română

