 English
  Русский
 Bahasa Indonesia
 Bahasa Malay
 ไทย
ไทย Español
 Deutsch
 Български
 Français
 Tiếng Việt
 中文
中文 বাংলা
বাংলা हिन्दी
 Čeština
 Українська
 Română

Trend analysis (Fig. 1)
On Wednesday, from the level of 1.1041 (closing of yesterday's daily candle), EUR/USD will rise and test the historical resistance level of 1.1063 (blue dashed line). After that, it may continue moving upward to the 76.4% retracement level of 1.1080 (blue dashed line).
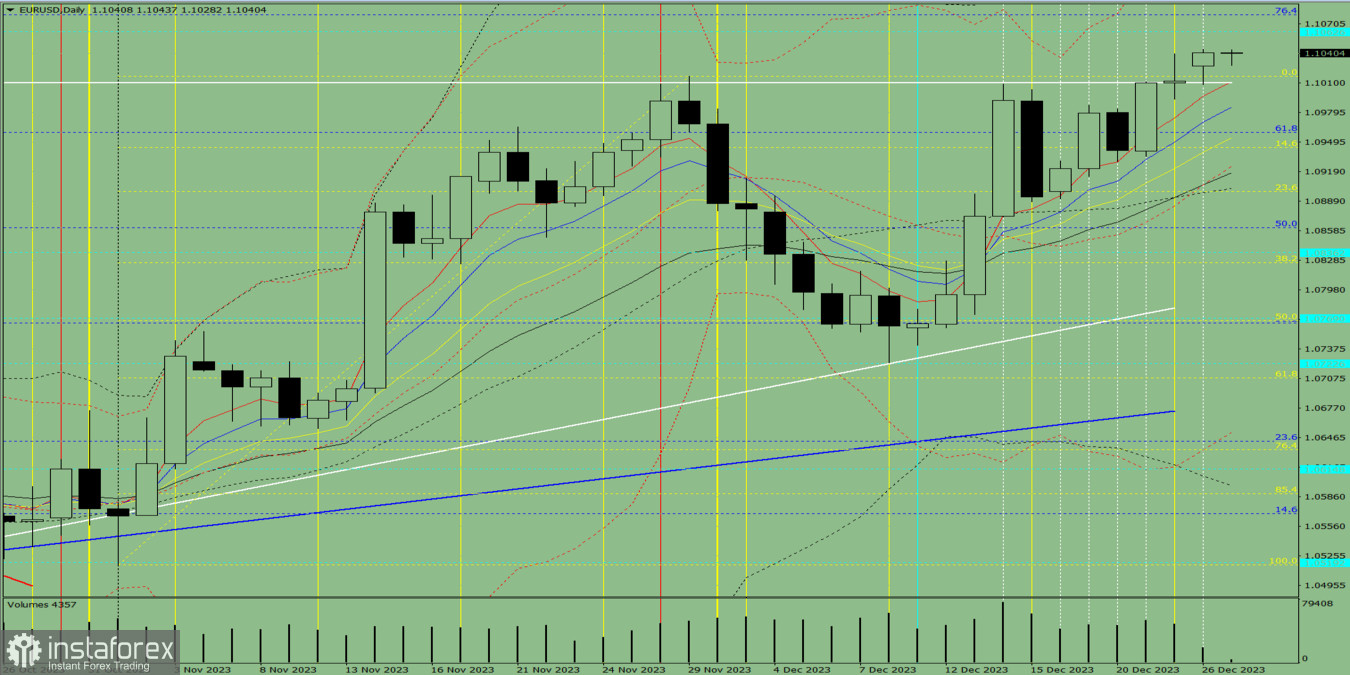
Fig. 1 (daily chart)
Comprehensive analysis:
Fibonacci levels - uptrend
Indicator analysis - uptrend
Volume - uptrend
Candlestick analysis - uptrend
Trend analysis - uptrend
Bollinger bands - uptrend
Weekly chart - uptrend
Conclusion: Moving upwards from the level of 1.1041 (closing of yesterday's daily candle), EUR/USD will test the historical resistance level of 1.1063 (blue dashed line), and then head to the 76.4% retracement level of 1.1080 (blue dashed line).
Alternatively, it could climb from the level of 1.1041 (closing of yesterday's daily candle) to the historical resistance level of 1.1063 (blue dashed line), followed by a decline to the upper fractal at 1.1040 (daily candle from December 22, 2023).