 English
  Русский
 Bahasa Indonesia
 Bahasa Malay
 ไทย
ไทย Español
 Deutsch
 Български
 Français
 Tiếng Việt
 中文
中文 বাংলা
বাংলা हिन्दी
 Čeština
 Українська
 Română

Analysis of GBP/USD 5M
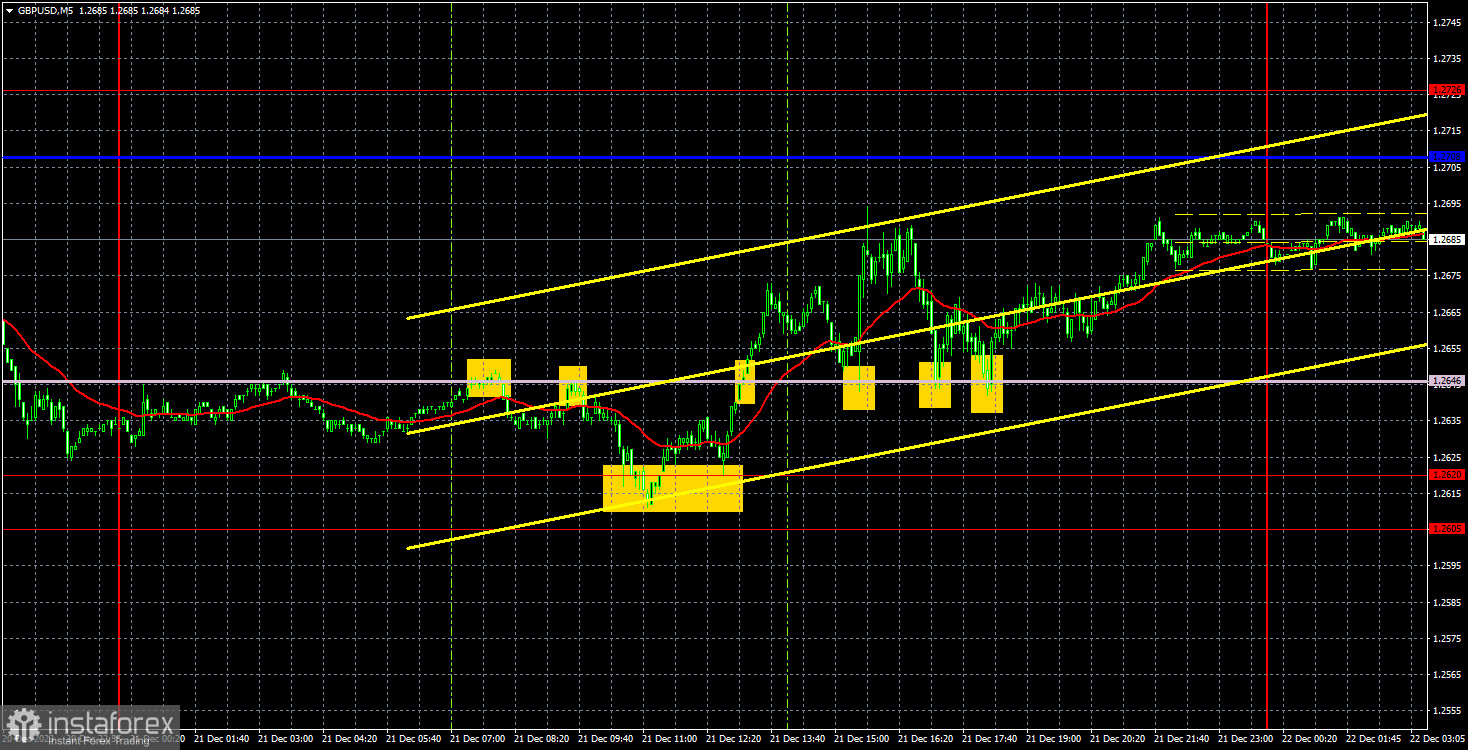
GBP/USD also traded higher on Thursday. The UK did not release any reports, and yet the British currency found reasons to strengthen further. The movement wasn't strong, but the pound still grew. We believe that the pair rose for purely technical reasons. We already warned you that it could bounce from the area of 1.2605-1.2620. And that's exactly what happened. Currently, the price has returned to the critical line, from which it could also rebound and make a new attempt towards the area of 1.2605-1.2620. If this happens, the chances of starting a downtrend will increase.
Yesterday's US Q3 GDP data was the only report that was important. During its release, it had a significant impact on the dollar's exchange rate – the price literally rose by 30 pips in 10 minutes. But what is 30 pips for the GBP/USD pair? It's negligible. Within half an hour, the price returned to its initial position. Therefore, we came to the conclusion that there was no market reaction at all.
Take note that the pair could not overcome the important area of 1.2605-1.2620 and the Senkou Span B line, indicating that the uptrend is still intact, and the pound may continue to rise. The question is, what are the grounds for this? From our perspective, there are still none, and we still consider all the upward movement of the last two months as a correction.
Speaking of trading signals, there were several entry points yesterday. The distance between the area of 1.2605-1.2620 and the Senkou Span B line did not exceed 26 pips, so it was dangerous to trade between them. However, when the price consolidated above the Senkou Span B line, it was possible to open long positions with the Kijun-sen line as the target. The pair did not reach its target during the day, and it bounced off the Senkou Span B line two more times. However, it was possible to earn about 25 pips from the last long position.
COT report:
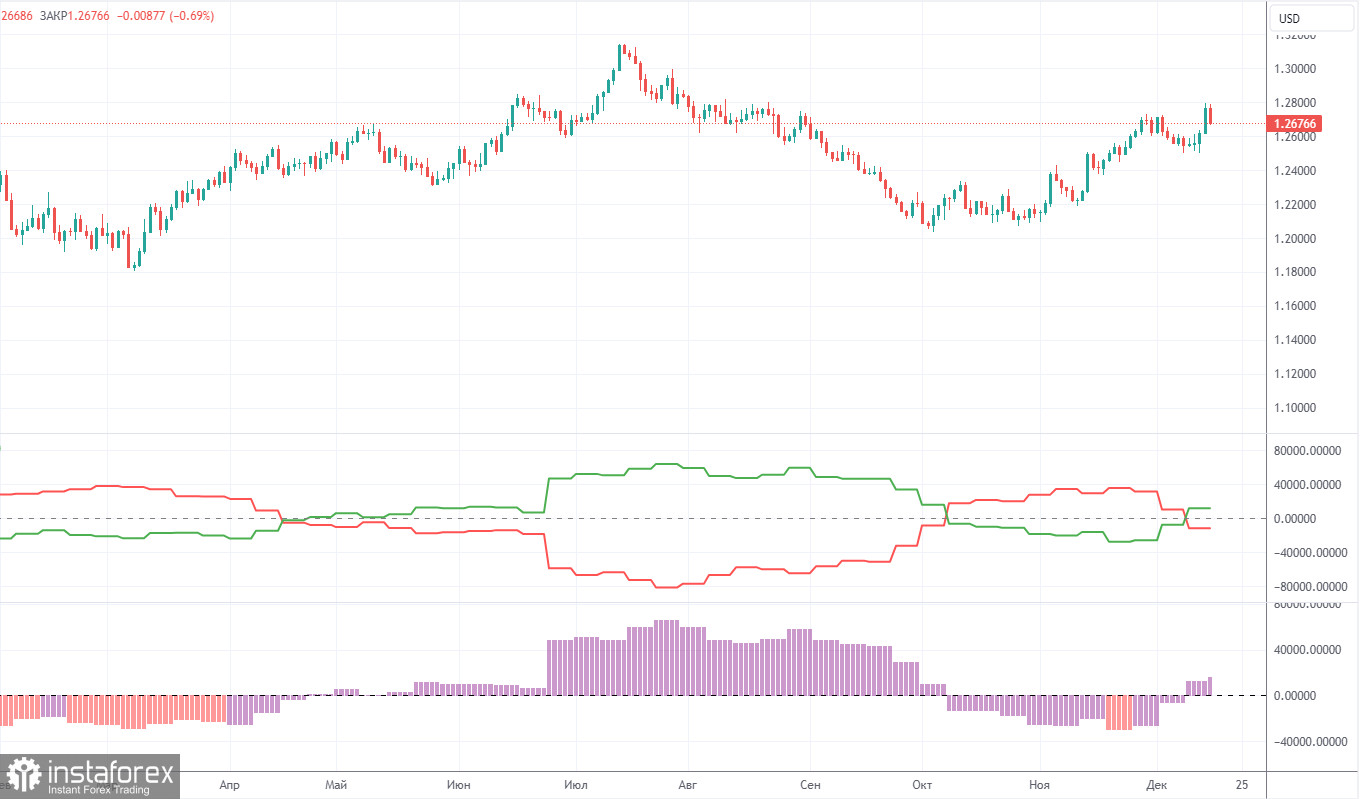
COT reports on the British pound show that the sentiment of commercial traders has been changing quite frequently in recent months. The red and green lines, representing the net positions of commercial and non-commercial traders, often intersect and, in most cases, are not far from the zero mark. According to the latest report on the British pound, the non-commercial group opened 5,600 long positions and closed 4,200 short ones. Therefore, the net position of non-commercial traders increased by 9,800 contracts in a week. Since bulls do not currently dominate the market, we don't think that the British currency will continue to rise for a long time.
The non-commercial group currently has a total of 72,000 long positions and 50,400 short ones. Since the COT reports cannot make an accurate forecast of the market's behavior at the moment, and the fundamentals are practically the same for both currencies, we can only consider the technical picture and economic reports. The technical analysis allows us to expect a strong downtrend, and the economic reports have been significantly stronger in the United States than in the United Kingdom.
Analysis of GBP/USD 1H
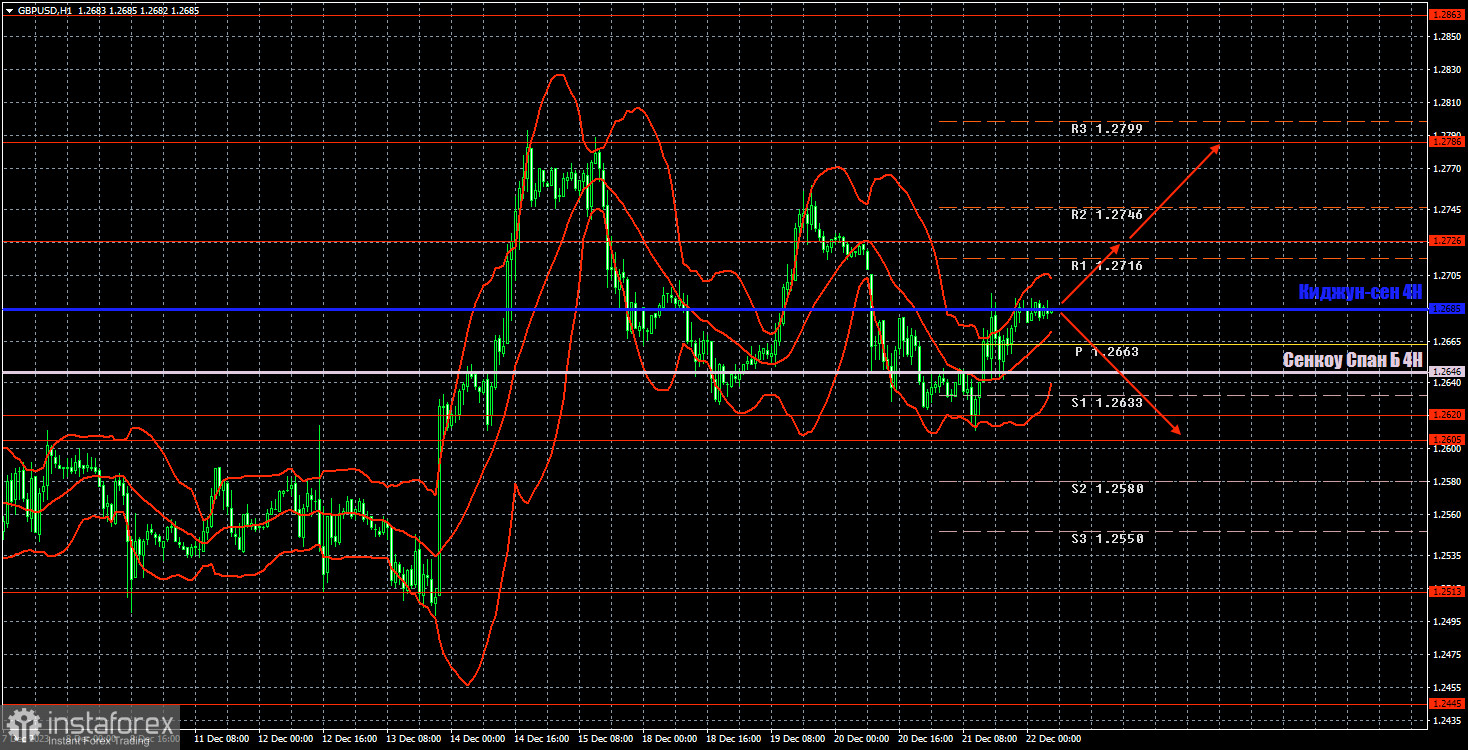
On the 1H chart, GBP/USD is making every effort to correct lower, but the uptrend persists. We believe that there are no reasons for the British pound to experience long-term growth, and there still aren't any. Therefore, at the very least, we expect the pair to return to the level of 1.2513. But it would be foolish to deny that the uptrend persists, so selling without appropriate signals is not advisable.
On Friday, we will closely monitor the price's behavior around the Kijun-sen line. It is possible for the pair to rebound and go back to moving downwards. If this happens, you can consider selling using 1.2605-1.2620 as the target. In case the price consolidates above the critical line, you can consider buying with 1.2726 and 1.2786 as the targets.
As of December 22, we highlight the following important levels: 1.2109, 1.2215, 1.2269, 1.2349, 1.2429-1.2445, 1.2513, 1.2605-1.2620, 1.2726, 1.2786, 1.2863, 1.2981-1.2987. The Senkou Span B (1.2646) and Kijun-sen (1.2685) lines can also be sources of signals. Signals can be "bounces" and "breakouts" of these levels and lines. It is recommended to set the Stop Loss level to break-even when the price moves in the right direction by 20 pips. The Ichimoku indicator lines can move during the day, which should be taken into account when determining trading signals. The illustration also includes support and resistance levels that can be used to lock in profits from trades.
Today, there won't be anything interesting in the UK again. The US docket will feature reports on personal consumption expenditures, the University of Michigan Consumer Sentiment Index, and Durable Goods Orders.
Description of the chart:
Support and resistance levels are thick red lines near which the trend may end. They do not provide trading signals;
The Kijun-sen and Senkou Span B lines are the lines of the Ichimoku indicator, plotted to the 1H timeframe from the 4H one. They provide trading signals;
Extreme levels are thin red lines from which the price bounced earlier. They provide trading signals;
Yellow lines are trend lines, trend channels, and any other technical patterns;
Indicator 1 on the COT charts is the net position size for each category of traders;
Indicator 2 on the COT charts is the net position size for the Non-commercial group.