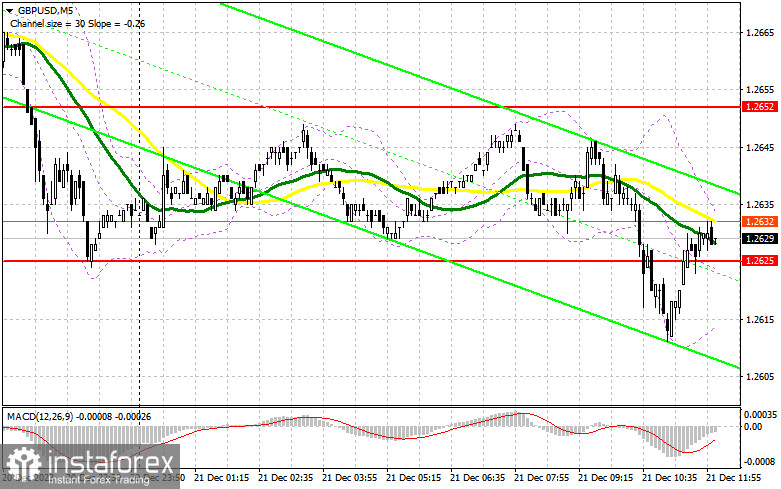
In my morning forecast, I drew attention to the level of 1.2625 and planned to make entry decisions based on it. Let's look at the 5-minute chart and analyze what happened. A decline to the 1.2625 level occurred, but I never saw the formation of a false breakout. The technical picture was revised for the second half of the day.

To open long positions in GBP/USD:
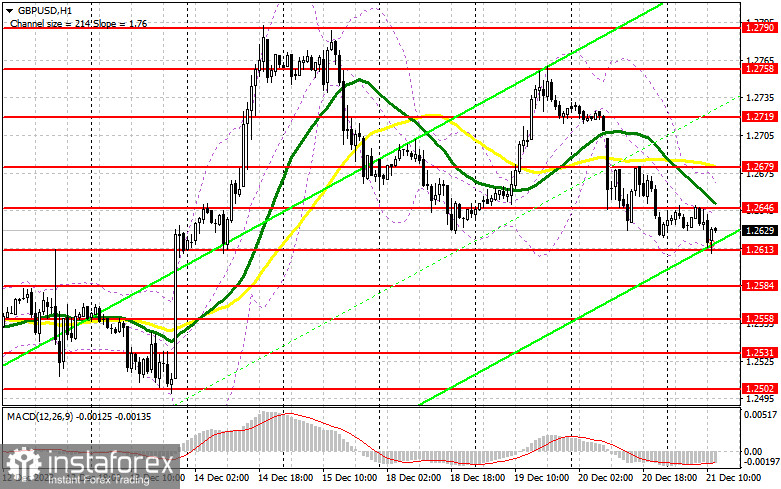
The pound, by inertia, fell today below weekly lows. However, support from major players still needs to be received, leading to only a slight change in the market picture. Now, much will depend on the US economic data. Figures on the number of initial claims for unemployment benefits are expected, but more interestingly, whether there will be a revision towards an increase in GDP for the third quarter of this year. Recall that the second preliminary estimate surprised many, resulting in the strengthening of the US dollar. We will find out what the third and final estimate will be very soon. The Philadelphia Federal Reserve Manufacturing Index is unlikely to play a significant role in determining market direction. If the data does not disappoint, the pair will continue to decline. In this case, I plan to act around the new support at 1.2613, based on the results of the first half of the day. I believe forming a false breakout there will create a suitable entry point into long positions with the target of moving towards 1.2646—the daily maximum. A breakout and consolidation above this range will lead to the removal of bear stop orders and a more pronounced pound rise to 1.2679. The ultimate target will be 1.2719, where I will take profit. In the scenario of further pair decline and a lack of activity from bulls at 1.2613 in the second half of the day, as everything seems to be heading, pressure on the pair will increase. In this case, only a false breakout around the next support at 1.2584 will allow considering opening long positions. I plan to buy GBP/USD immediately on a rebound only from 1.2558, with the target of a pair correction downward by 30-35 points within the day.
To open short positions on GBP/USD:
Sellers maintain control of the market. There could be an upward surge in the pair in the case of weak US statistics. In this case, bears will surely try to defend the nearest resistance at 1.2646, where the formation of a false breakout would be a suitable entry point for me to sell the pound with the target of another decline to around 1.2613, formed based on the results of the first half of the day. A breakout and a reverse test from the bottom to the top of this range against the backdrop of strong US statistics will seriously blow bull positions, potentially leading to the removal of stop orders and opening the path to 1.2584. A more distant target will be the area of 1.2558, where I will take profit. With GBP/USD growth and a lack of activity at 1.2646 in the second half of the day, buyers can expect the pound's decline to stop and the pair to be locked in a sideways channel. In this case, I will postpone sales until a false breakout at 1.2679, where moving averages are located, playing in favor of sellers. If there is no downward movement, I will sell GBP/USD immediately on a rebound from 1.2719, but only counting on a pair correction downward by 30-35 points within the day.


Indicator Signals:
Moving Averages:
Trading is below the 30 and 50-day moving averages, indicating further pair decline.
Bollinger Bands:
In case of decline, the lower boundary of the indicator, around 1.2613, will act as support.
Description of Indicators:
- Moving Average (50-day): Yellow color on the chart.
- Moving Average (30-day): Green color on the chart.
- MACD Indicator (12-26-9): Fast EMA period 12, Slow EMA period 26, SMA period 9.
- Bollinger Bands (20): Period 20.
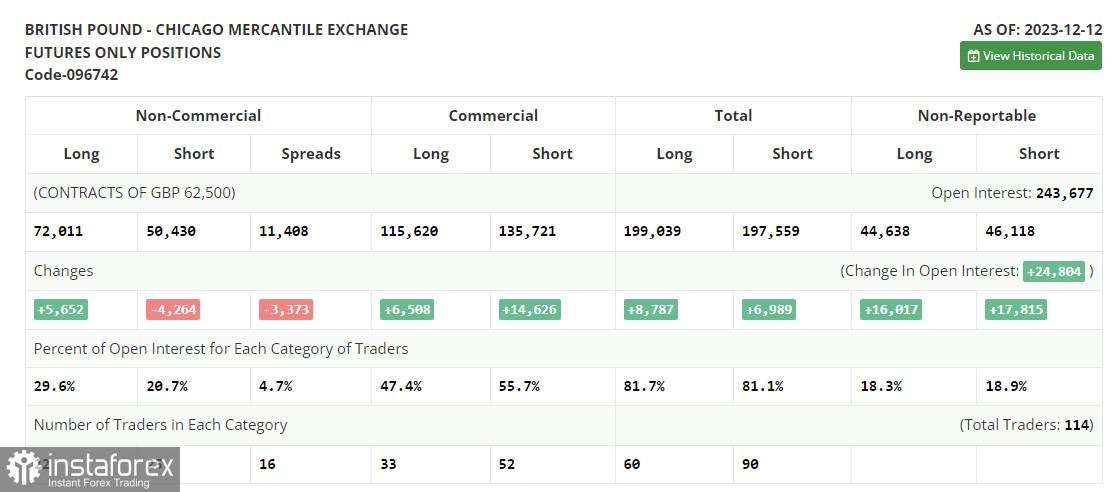
- Non-commercial traders: Speculators, including individual traders, hedge funds, and large institutions, use the futures market for speculative purposes and meet certain requirements.
- Long non-commercial positions: The total long open positions of non-commercial traders.
- Short non-commercial positions: The total short open positions of non-commercial traders.
- Total non-commercial net position: The difference between short and long positions of non-commercial traders.
 English
 Русский
 Bahasa Indonesia
 Bahasa Malay
 ไทย
ไทย Español
 Deutsch
 Български
 Français
 Tiếng Việt
 中文
中文 বাংলা
বাংলা हिन्दी
 Čeština
 Українська
 Română

