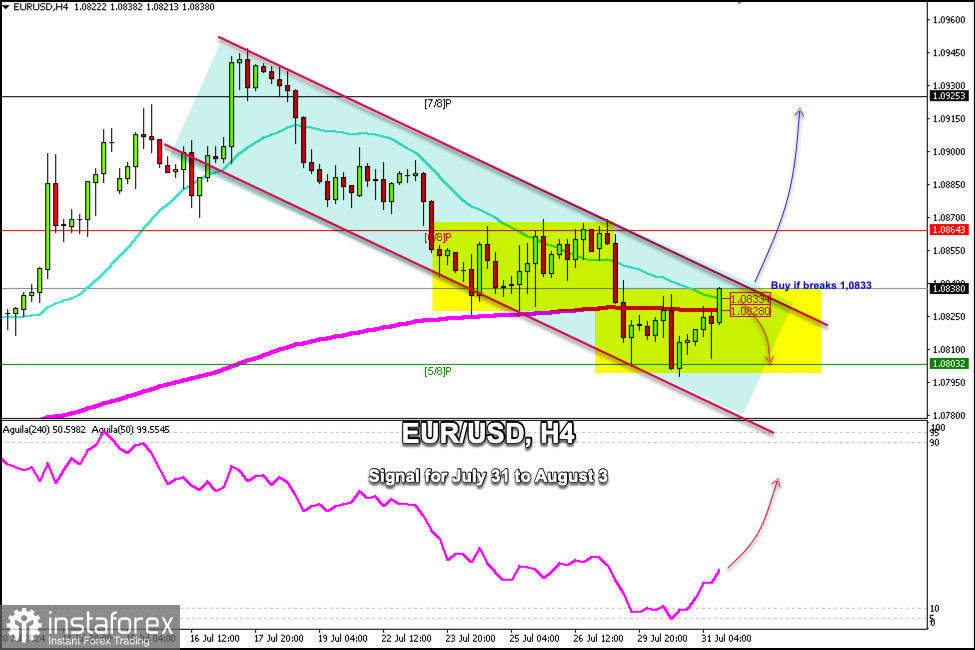
Early in the American session, EUR/USD is trading around 1.0833, above the 200 EMA, and above the 21 SMA, indicating a recovery. On the H4 chart, we can see that the euro is trading within a bearish trend channel forming since July 16th and reaching a resistance zone that coincides with the top of the bearish channel.
We reckon that a sharp break of this channel could occur in the next few hours, which would mean a change in the trend. Otherwise, the euro could find a rejection and then continue trading within the rectangle pattern.
In the chart above, we can see that the Euro has been trading within a range zone. If it fails to break the downtrend channel, we could expect EUR/USD to return towards 5/8 Murray located at 1.0803. It could even reach the bottom of the downtrend channel around 1.0780.
In the next few hours, the US Federal Reserve will announce its decision on the funds rate, which could generate a strong movement in EUR/USD. If the Fed's rhetoric is dovish in favor of a rate cut, we could expect a continuation of the bullish movement. Therefore, EUR/USD could climb to 1.0864 or even 1.0925.
The eagle indicator is showing a positive signal. So, we believe that if a technical correction occurs towards 1.0803 or even towards 1.0780, it will be seen as an opportunity to continue buying in the coming days.
 English
 Русский
 Bahasa Indonesia
 Bahasa Malay
 ไทย
ไทย Español
 Deutsch
 Български
 Français
 Tiếng Việt
 中文
中文 বাংলা
বাংলা हिन्दी
 Čeština
 Українська
 Română

