On Wednesday at 07:00 (GMT), the UK's Office for National Statistics will publish fresh data on inflation in the country.
In the previous reporting month (October), the growth of consumer inflation slowed to 0% (4.6% year-on-year). The Core Consumer Price Index (Core CPI), which determines the change in prices for a selected basket of goods and services (excluding food and energy) in October, rose by 5.7% YoY after rising by 6.1%, 6.2% two months earlier.
Despite the relative decrease, the data indicates persistent high inflationary pressure, which may support the pound.
On Monday, Bank of England Deputy Governor Ben Broadbent stated that to change the vector of monetary policy, it is necessary to wait for stable signs that the growth of wages, as a key factor in inflationary pressure, is significantly decreasing. However, so far, macroeconomic statistics remain contradictory. If tomorrow, British CPI accelerates again, it will confirm the hawkish statement on monetary policy made by the Bank of England last week.
The leaders of the Bank of England, whose meeting took place last Thursday, left interest rates unchanged but expressed their intention to maintain rates at high levels for a "prolonged period," expressing concerns about sustainably high inflation in the services sector and wages. In their opinion, indicators of inflation stability in the UK are higher than in other large developed economies.
On Monday, Bank of England Governor Andrew Bailey confirmed that it is premature to discuss lowering rates, emphasizing that the authorities cannot assert that interest rates have reached their peak.
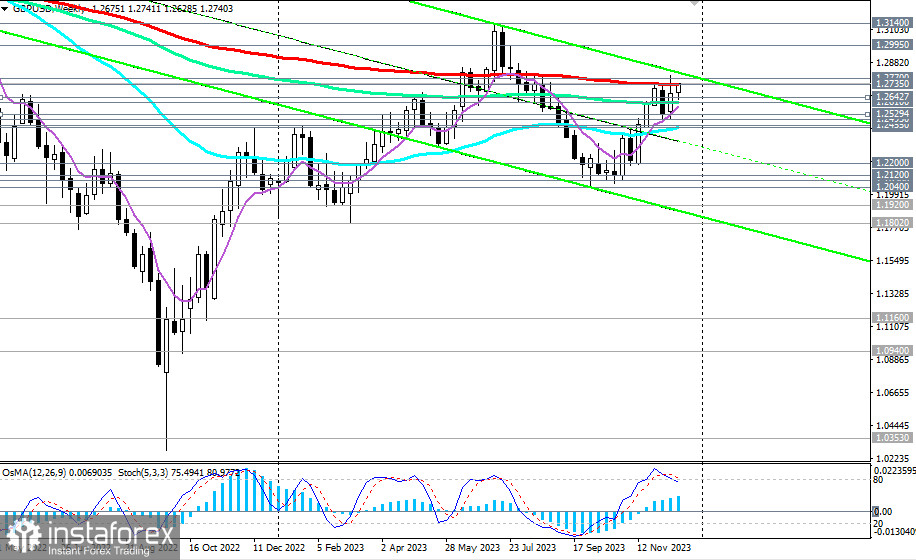
After multiple attempts to break the key resistance level of 1.2735 (200 EMA on the weekly chart), today, GBP/USD once again approached it closely, trying to break into the long-term bullish market zone.
After breaking through the resistance levels of 1.2770 (50 EMA on the monthly chart) and 1.2800, the targets will be local resistance levels 1.3000 and 1.3140. Talking about a stronger pair growth is premature, and it is pointless to theoretically speculate.
While GBP/USD remains in the zone of the long-term bearish market (below the key resistance level of 1.2735), long-term short positions are still preferable, but the pair has been demonstrating a corrective rise for the second month in a row, making long positions relevant in the short and medium term.

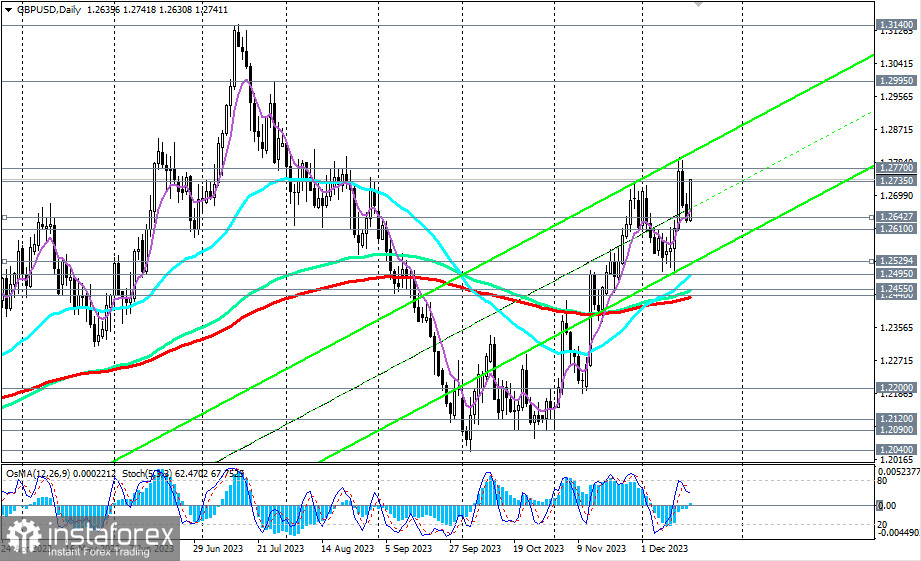
The risks of a decline in GBP/USD still prevail over the prospects of its growth. The breakdown of the key support level 1.2440 (200 EMA on the daily chart) will be critical for GBP/USD here, which will mean a transition to the medium-term bearish market zone and a resumption of the long-term downward trend.
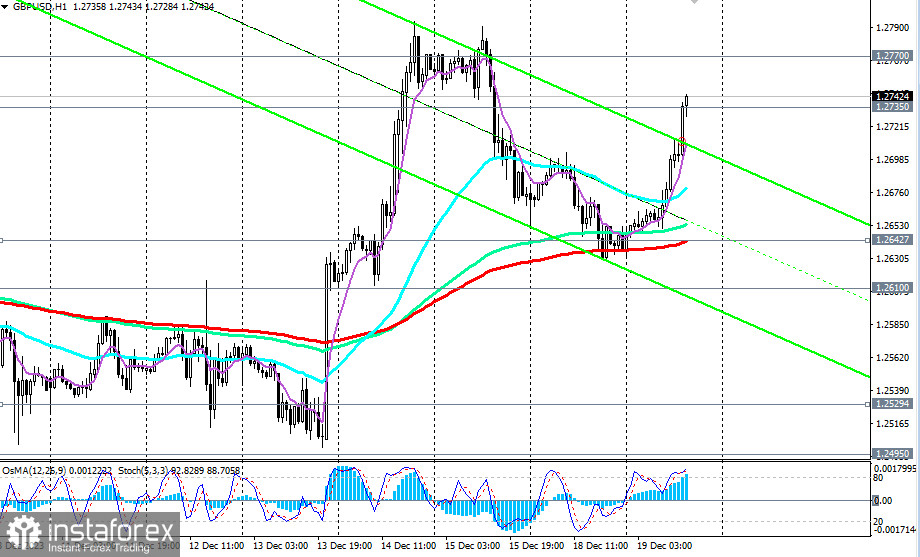
The first signal for the development of this scenario is the breakdown of the "round" support level of 1.2700, and the confirming signal is the breakdown of the short-term support level of 1.2643 (200 EMA on the 1-hour chart).

In an alternative scenario, and after breaking through the resistance zone at levels 1.2735, 1.2770, 1.2800, the rise, as we assumed above, may continue towards the marks 1.3000, 1.3140.
Support levels: 1.2700, 1.2643, 1.2610, 1.2600, 1.2529, 1.2495, 1.2455, 1.2440, 1.2400
Resistance levels: 1.2735, 1.2770, 1.2800, 1.2900, 1.2995, 1.3100, 1.3140, 1.3200
Trading Scenarios
Main Scenario: Sell Stop 1.2685. Stop-Loss 1.2785. Targets 1.2643, 1.2610, 1.2600, 1.2529, 1.2495, 1.2455, 1.2440, 1.2400, 1.2300, 1.2200, 1.2120, 1.2100, 1.2090, 1.2040, 1.2000
Alternative Scenario: Buy Stop 1.2785. Stop-Loss 1.2685. Targets 1.2800, 1.2900, 1.2995, 1.3100, 1.3140, 1.3200
"Targets" correspond to support/resistance levels. This also does not mean that they will necessarily be reached, but they can serve as a guide when planning and placing your trading positions.
 English
 Русский
 Bahasa Indonesia
 Bahasa Malay
 ไทย
ไทย Español
 Deutsch
 Български
 Français
 Tiếng Việt
 中文
中文 বাংলা
বাংলা हिन्दी
 Čeština
 Українська
 Română

