"We will not raise interest anymore," stated earlier today by European Central Bank Governing Council member and Bank of France President Francois Villeroy de Galhau. In his opinion, "inflation will continue to slow down... reach 2% by the end of 2025," and the ECB will be able to lower interest rates.
To confirm his words, at the beginning of today's European trading session, Eurostat confirmed in the final assessment the deceleration of inflation in the Eurozone.

These data slowed down the upward correction of the euro and the EUR/USD pair that started on Monday.
Nevertheless, amid a weakening dollar, EUR/USD continues to correct upwards today after a sharp decline at the end of last week.
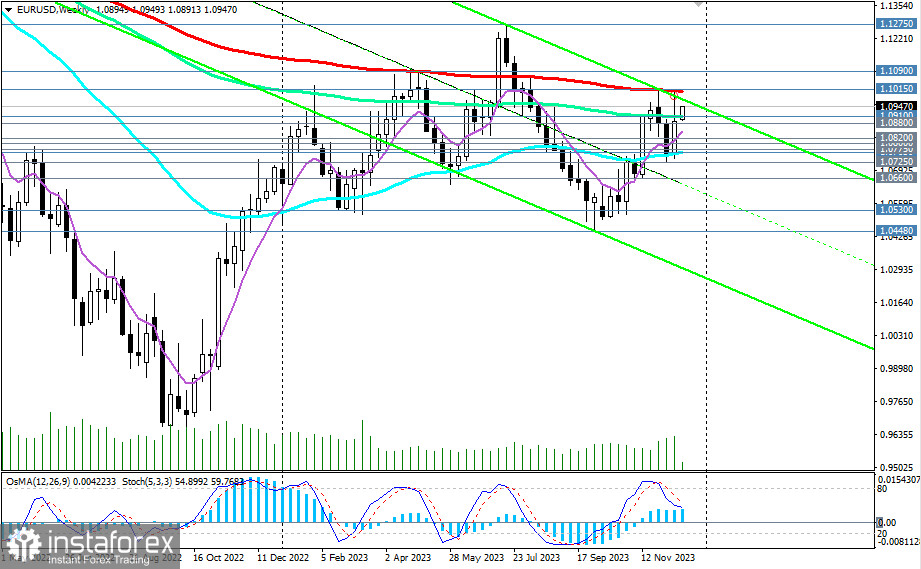
As of this writing, EUR/USD was trading near the level of 1.0945, moving towards the key long-term resistance level of 1.1015 (200 EMA on the weekly chart). Last week and at the end of November, it already approached this level closely.
Its breakout will lead EUR/USD into the zone of a long-term bullish market, making long-term long positions on the pair promising.
However, the main events around the dollar, the euro, and the EUR/USD pair will likely unfold early next year.
Next week, market activity is expected to be low as the world prepares for the New Year 2024. There will also be few macroeconomic statistics publications.
The euro may receive support from verbal interventions by ECB leaders if they continue to make "hawkish" statements about the prospects of monetary policy, while the dollar, after the known events of last week, remains under pressure.
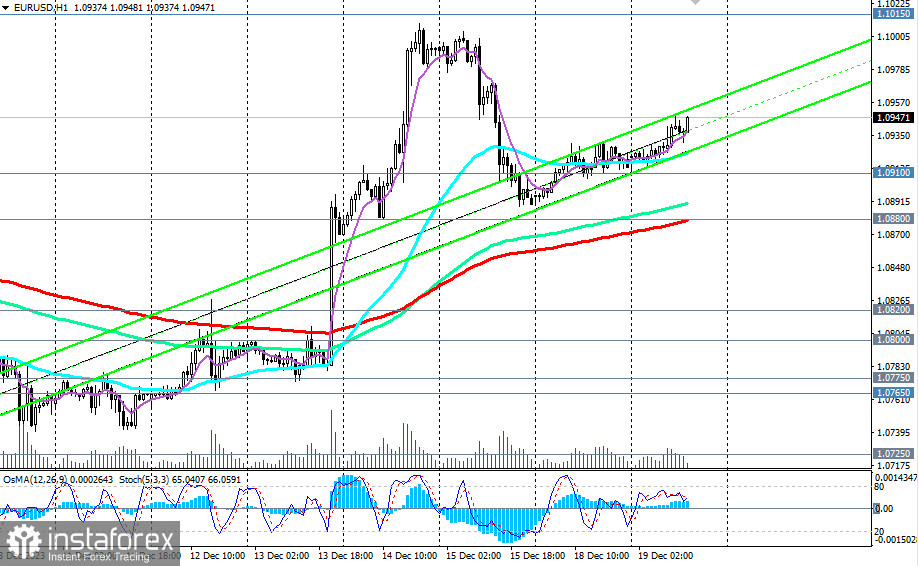
Therefore, in the remaining days before the New Year, EUR/USD will likely stay in the range between important levels – support at 1.0910 (144 EMA on the weekly chart) and resistance at 1.1015.

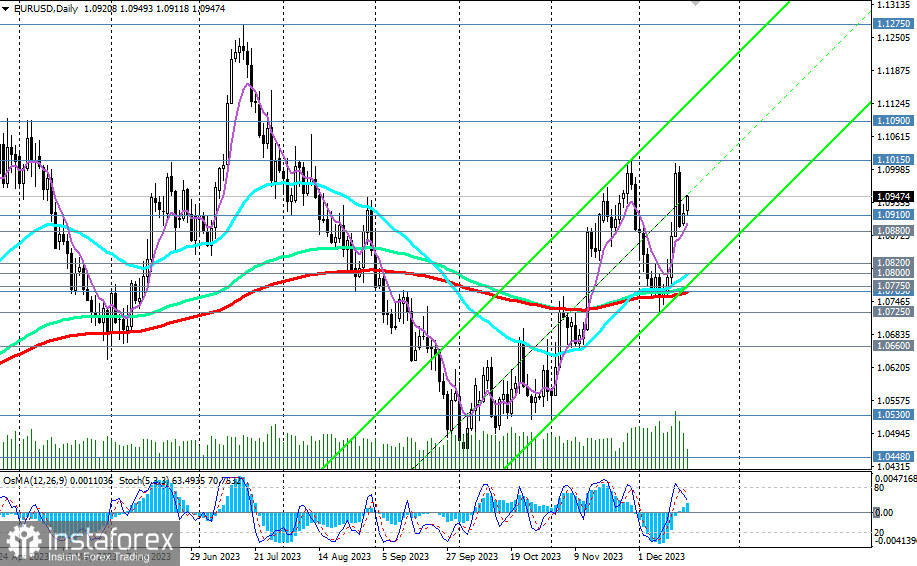
In an alternative scenario, EUR/USD will resume its decline towards key support levels at 1.0775 (144 EMA on the daily chart) and 1.0765 (200 EMA on the daily chart).
Further decline and a break below the local support level at 1.0725 will return EUR/USD to a long-term downward trend.
The first signal for the start of the implementation of this scenario may be the breakdown of the important support level at 1.0910, and the breakdown of the support level at 1.0880 (200 EMA on the 1-hour chart) will be the confirmation.
Support levels: 1.0910, 1.0900, 1.0880, 1.0820, 1.0800, 1.0775, 1.0765, 1.0725, 1.0700, 1.0600, 1.0530, 1.0500, 1.0450, 1.0400, 1.0300
Resistance levels: 1.0950, 1.1000, 1.1015, 1.1090, 1.1100, 1.1200, 1.1275, 1.1300, 1.1400, 1.1500, 1.1600
Trading Scenarios
Main Scenario: Buy Stop 1.0960. Stop-Loss 1.0890. Targets 1.1000, 1.1015, 1.1090, 1.1100, 1.1200, 1.1275, 1.1300, 1.1400, 1.1500, 1.1600
Alternative Scenario: Sell Stop 1.0890. Stop-Loss 1.0960. 1.0880, 1.0820, 1.0800, 1.0775, 1.0765, 1.0725, 1.0700, 1.0600, 1.0530, 1.0500, 1.0450, 1.0400, 1.0300
"Targets" correspond to support/resistance levels. This also does not mean that they will necessarily be reached, but they can serve as a guide when planning and placing your trading positions.
 English
 Русский
 Bahasa Indonesia
 Bahasa Malay
 ไทย
ไทย Español
 Deutsch
 Български
 Français
 Tiếng Việt
 中文
中文 বাংলা
বাংলা हिन्दी
 Čeština
 Українська
 Română

