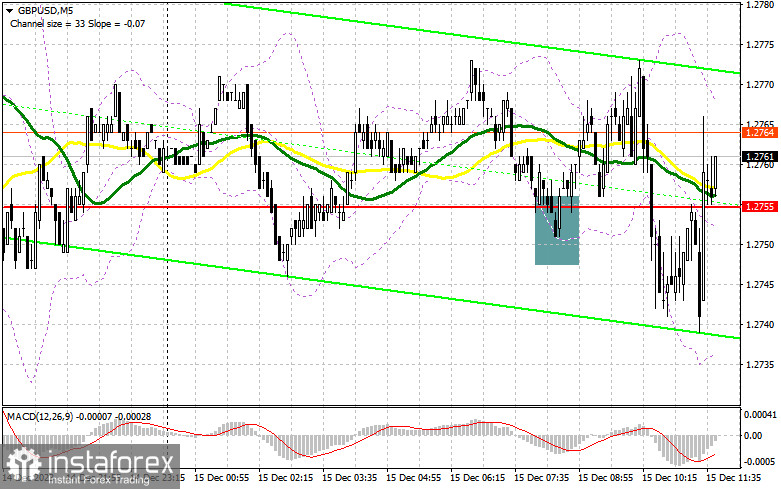
In my morning forecast, I drew attention to the level of 1.2755 and recommended making trading decisions based on it. Let's take a look at the 5-minute chart and analyze what happened there. The decline and the formation of a false breakout at 1.2755 led to an excellent entry point for long positions, resulting in an upward movement of 20 points. However, the buyers' activity slowed down afterward. For the second half of the day, the technical picture was revised.

To open long positions on GBP/USD, it is required:
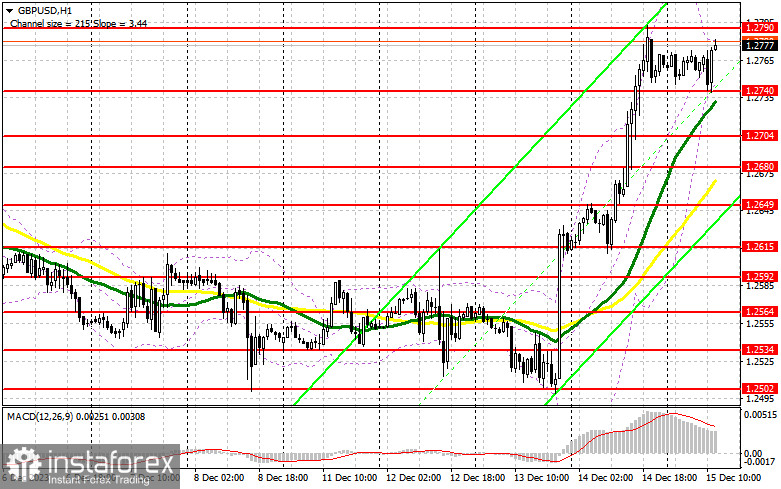
Good data on activity in the UK led to the growth of the British pound in the first half of the day. Weak data in the manufacturing sector was offset by excellent indicators for service sector activity, which accounts for a significant part of the British economy. As a result, the pound reacted with growth in continuation of the upward trend observed since mid-week. In the second half of the day, we will look at the figures for the Manufacturing Purchasing Managers' Index (PMI), the Services Business Activity Index, and the Composite PMI for the United States, as well as changes in industrial production. If the data turns out to be better than economists' forecasts, pressure on the pound will return, and I suggest taking advantage of that. The optimal scenario would be to defend the support at 1.2740, formed by the end of the first half of the day. A false breakout there would provide an entry point for long positions with the aim of further growth of GBP/USD and the update of the new weekly maximum at 1.2790. Breaking and consolidating above this range can be expected only with very weak US data, leading to the clearing of bearish stop orders and a sharper rise in the pound towards 1.2820. The ultimate target will be the area of 1.2853, where I will make a profit. In the scenario of a pair's decline and the absence of bullish activity at 1.2740 in the second half of the day, pressure on the pair will increase significantly. Only a false breakout in the area of the next support at 1.2704, where the moving averages intersect, will signal the opening of long positions. I plan to buy GBP/USD immediately on a rebound only from 1.2680, aiming for a pair correction down by 30-35 points within the day.
To open short positions on GBP/USD, the following is required:
Sellers tried, but nothing came out of it. There were not many willing to sell in such a bullish market, and the data from the UK managed to please, which restored demand for risky assets. Now, only the formation of a false breakout around the monthly maximum of 1.2790 will allow for a sell signal and a chance for a small downward movement at the end of the week to support at 1.2740, formed by the end of the first half of the day. Breaking and reverse testing from the bottom to the top of this range will deal a more serious blow to bullish positions, leading to the clearing of stop orders and opening the way to 1.2704, and then very close to 1.2680. A more distant target will be the area of 1.2649, where I will take profit. In the scenario of GBP/USD growth and the absence of activity at 1.2790 in the second half of the day, as everything is heading towards, I will postpone sales until a false breakout at 1.2820. If there is no downward movement there as well, I will sell GBP/USD immediately on a rebound from 1.2853, but only counting on a pair correction down by 30-35 points within the day.


Indicator signals:
Moving averages:
Trading is conducted above the 30 and 50-day moving averages, indicating further pair growth.
Note: The author considers the periods and prices of moving averages on the hourly chart H1, which differs from the general definition of classical daily moving averages on the daily chart D1.
Bollinger Bands:
In case of a decline, the lower boundary of the indicator at around 1.2740 will act as support.
Indicator Descriptions:
- Moving average (MA, determines the current trend by smoothing volatility and noise). Period 50. Marked on the chart in yellow.
- Moving average (MA, determines the current trend by smoothing volatility and noise). Period 30. Marked on the chart in green.
- MACD indicator (Moving Average Convergence/Divergence, determines the convergence/divergence of moving averages). Fast EMA period 12. Slow EMA period 26. SMA period 9.
- Bollinger Bands (Bollinger Bands). Period 20.
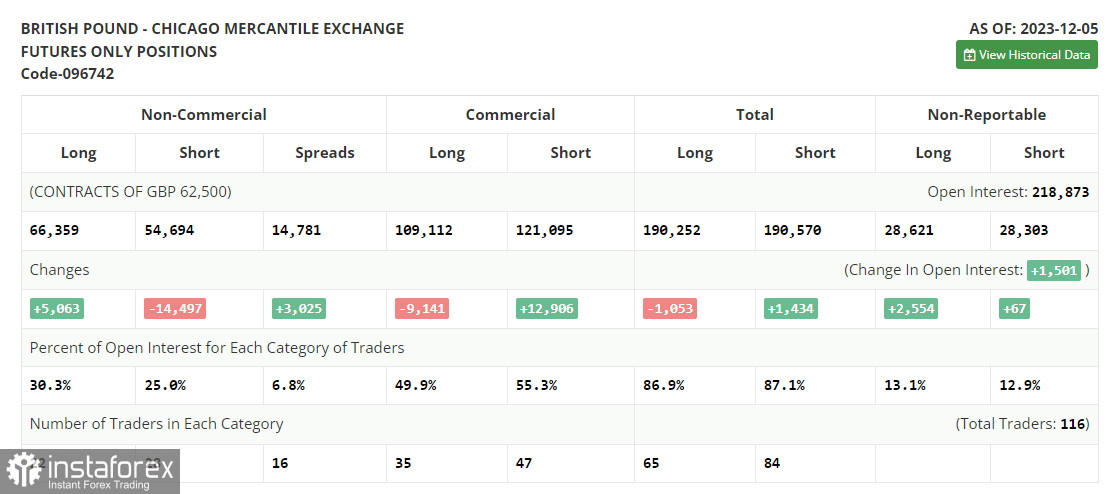
- Non-commercial traders - speculators, such as individual traders, hedge funds, and large institutions using the futures market for speculative purposes and meeting certain requirements.
- Long non-commercial positions represent the total long open position of non-commercial traders.
- Short non-commercial positions represent the total short open positions of non-commercial traders.
- The total non-commercial net position is the difference between the short and long positions of non-commercial traders.
 English
 Русский
 Bahasa Indonesia
 Bahasa Malay
 ไทย
ไทย Español
 Deutsch
 Български
 Français
 Tiếng Việt
 中文
中文 বাংলা
বাংলা हिन्दी
 Čeština
 Українська
 Română

