Details of the Economic Calendar on December 13
On Wednesday, investors' attention was on the results of the Federal Reserve meeting, where the regulator predictably kept the refinancing rate at 5.5%. However, Fed Chairman Jerome Powell clearly indicated a soon-to-come softening of the rhetoric on monetary policy, leading to the sell-off of dollar positions and the rise of U.S. indices.
Key points from Fed Chair Powell's speech:
- The Federal Reserve is proceeding with caution, considering its progress toward tightening monetary policy and the high level of uncertainty.
- The full consequences of tightening monetary policy are probably not yet felt.
- There is an absence of significant unemployment growth, and at the same time, we note positive changes in inflation control, which is encouraging news.
- However, the inflation rate remains high, and the future trajectory of the situation remains unpredictable. Our goal is to achieve a 2% inflation rate.
- The Federal Reserve has already reached or is near the peak of interest rates.
- The decrease in nominal wages in the country is a positive factor.
- We make decisions considering a broad range of data, not limiting ourselves to individual indicators.
- Readiness for additional interest rate hikes is maintained if necessary.
- The Federal Reserve will continue to pursue a tightening policy until it is convinced that inflation is moving towards the 2% Consumer Price Index level.
- Policymakers do not rule out the possibility of another rate hike.
 Analysis of Trading Charts from December 13
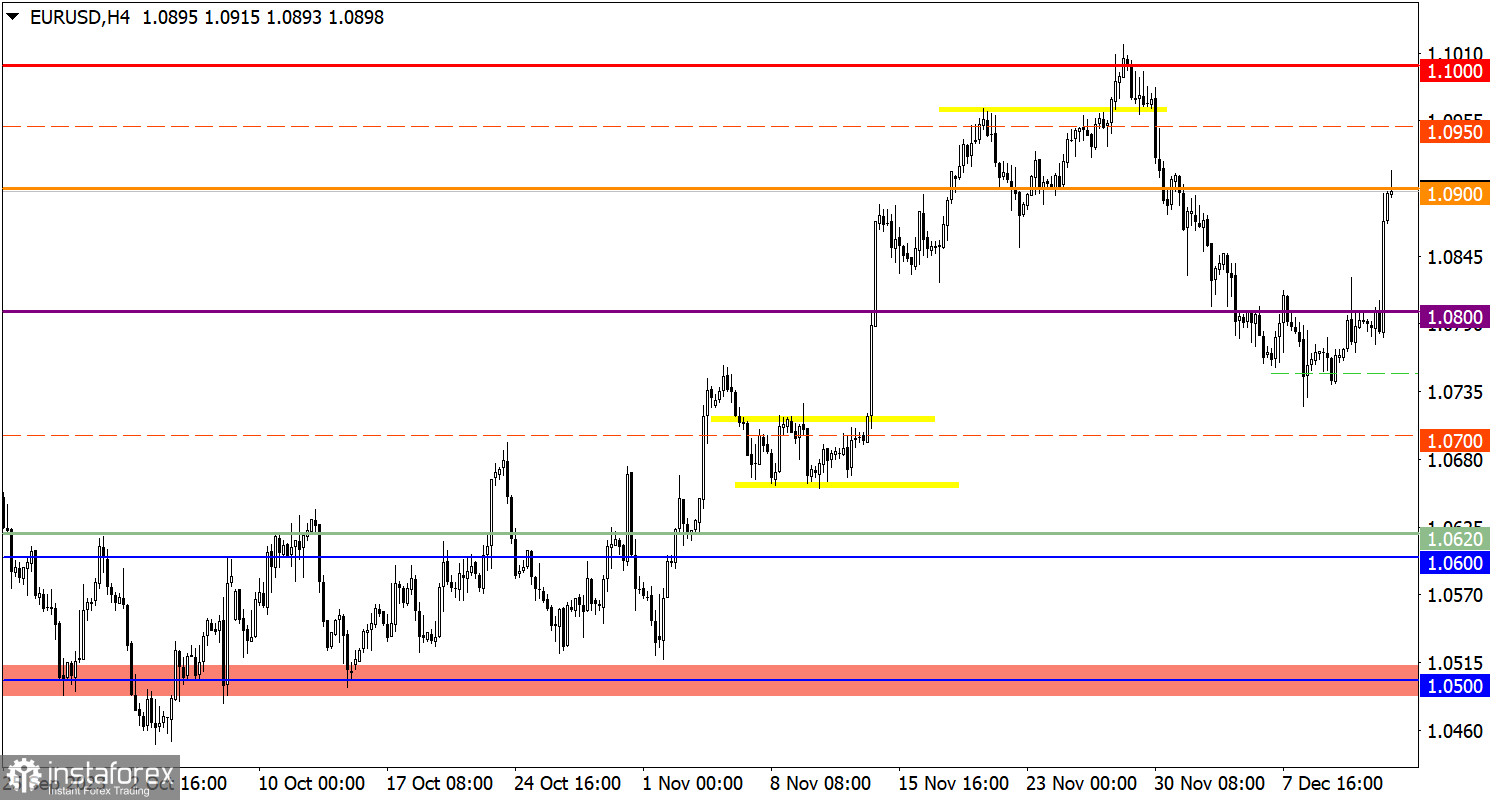
EUR/USD strengthened by 1%, leading to a significant increase in long positions. As a result, the quote jumped above the 1.0900 level, indicating the recovery of the euro's value relative to the correction phase.
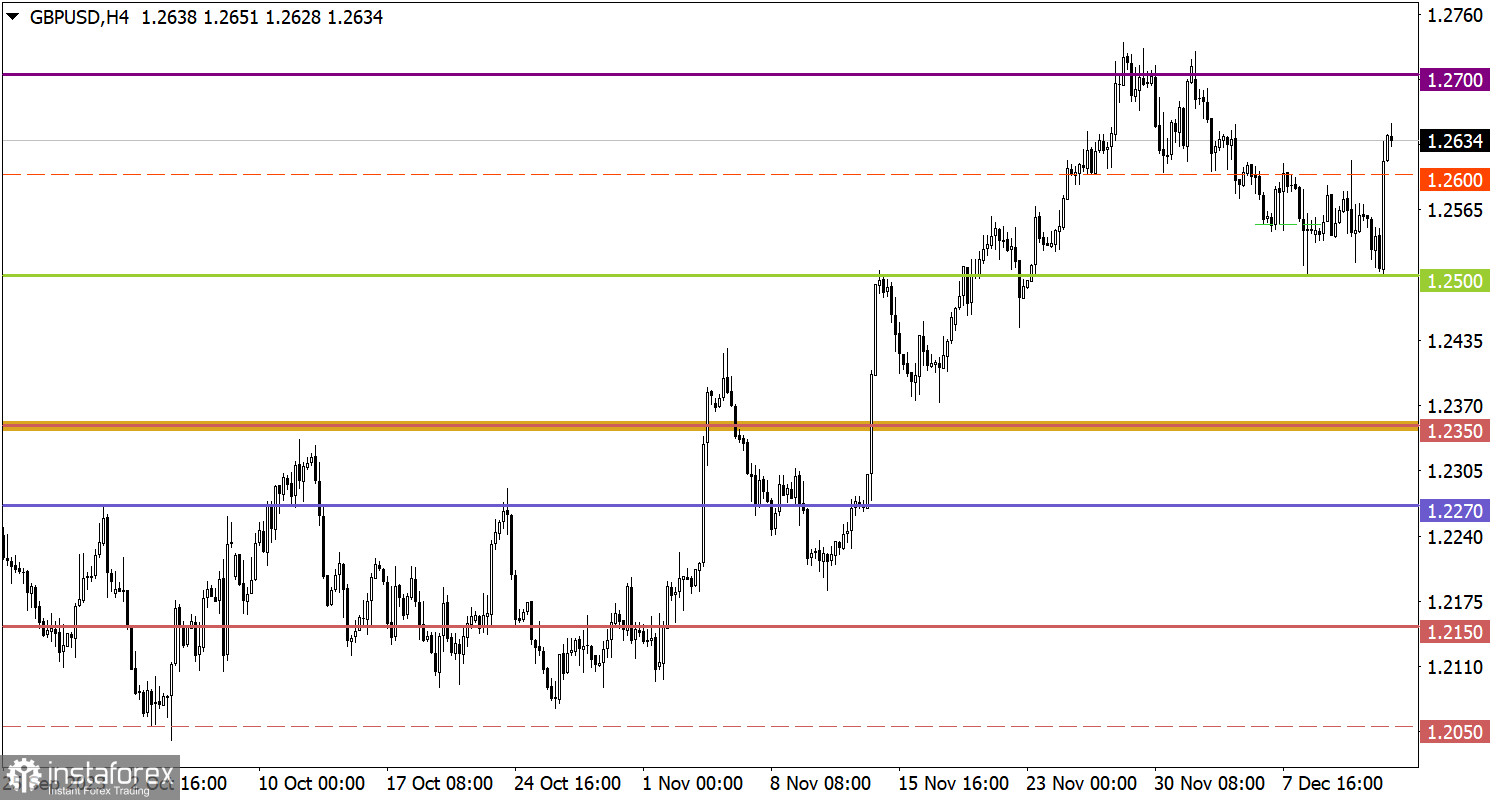
Amid widespread selling of dollar positions, GBP/USD experienced rapid growth. The level of 1.2500 serves as support, around which there was an increase in long positions.
Economic Calendar on December 14
Today, investors' attention will be on two consecutive central bank meetings, the results of which will undoubtedly lead to market speculation.
The first to report is the Bank of England, where the refinancing rate of 5.25% will remain unchanged. Investors are interested in the distribution of votes regarding rate cuts, hikes, and maintenance.
The European Central Bank (ECB) report will follow, where rates will also remain unchanged. In this case, special attention will given to the speech of ECB President Christine Lagarde, whose words will indicate the regulator's subsequent monetary policy.
EUR/USD Trading Plan for December 14
The stabilization of the price above the 1.0900 level allows for subsequent growth towards 1.1000. However, a slowdown in pace is possible due to the technical signal of overbought euro rates in the short term.

GBP/USD Trading Plan for December 14
In the case of further growth, a price move towards the resistance level of 1.2700 is allowed, with a complete recovery of the British currency's value relative to the recent corrective movement. It is worth noting that a sharp change in price over a short period may lead to a local overbought status in short-term timeframes.

What's on the charts
The candlestick chart type is white and black graphic rectangles with lines above and below. With a detailed analysis of each individual candle, you can see its characteristics relative to a particular time frame: opening price, closing price, intraday high and low.
Horizontal levels are price coordinates, relative to which a price may stop or reverse its trajectory. In the market, these levels are called support and resistance.
Circles and rectangles are highlighted examples where the price reversed in history. This color highlighting indicates horizontal lines that may put pressure on the asset's price in the future.
The up/down arrows are landmarks of the possible price direction in the future.
 English
 Русский
 Bahasa Indonesia
 Bahasa Malay
 ไทย
ไทย Español
 Deutsch
 Български
 Français
 Tiếng Việt
 中文
中文 বাংলা
বাংলা हिन्दी
 Čeština
 Українська
 Română

