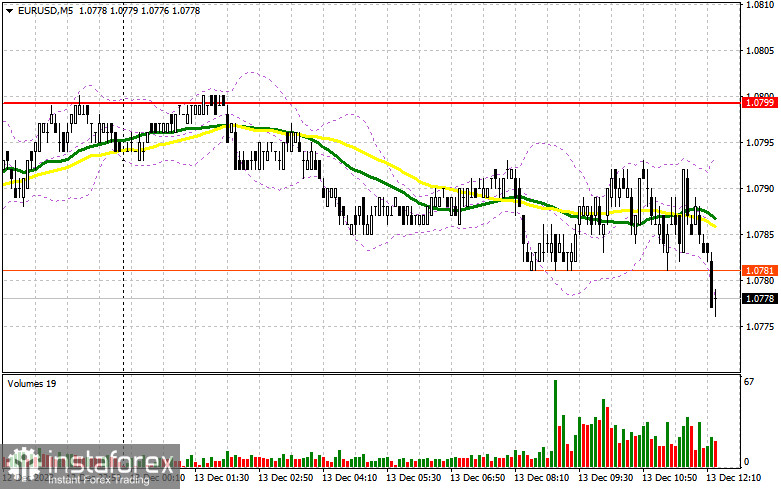
In my morning forecast, I highlighted the level of 1.0799 and recommended making entry decisions based on it. Let's take a look at the 5-minute chart and analyze what happened. Due to very low volatility, around 20 points, it was not possible to achieve updates to the levels I indicated, and accordingly, suitable entry points into the market were not obtained. The technical picture remained unchanged for the second half of the day.

To open long positions on EUR/USD, the following is required:
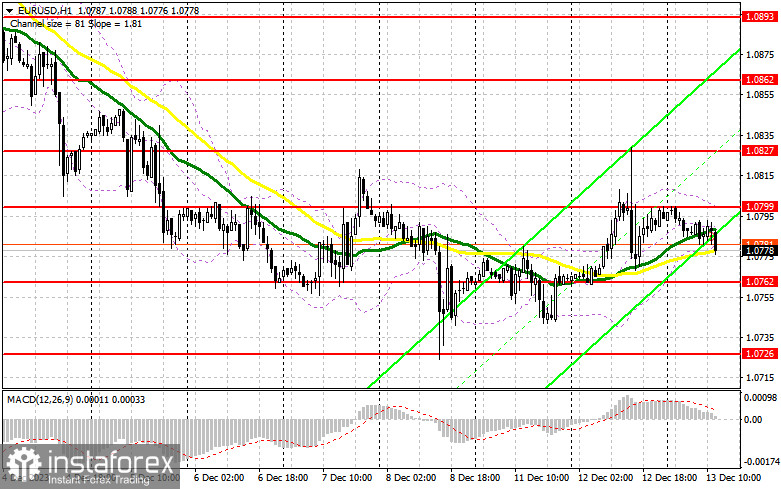
The lack of reaction to Eurozone data was quite expected. Ahead of us is a crucial decision by the Federal Reserve on interest rates. Considering that this is the last meeting of the year, expecting the committee to radically change its policy is unlikely. Yesterday's U.S. inflation data allowed the Fed to maintain the status quo, even shifting the focus to a more stringent scenario than previously anticipated. This would lead to a rise in the dollar and further weakening of the European currency, as observed earlier this month. For this reason, I will only consider buying on a decline from the support at 1.0762, which we did not reach in the first half of the day. A false breakout formation there would provide an entry point for long positions, anticipating a EUR/USD recovery and a test of resistance at 1.0799, formed after the end of yesterday's U.S. session. This area also intersects with the moving averages, favoring the sellers. A breakout of 1.0799 and an update from top to bottom, along with the Fed Chair's dovish rhetoric on future policy, would signal a buying opportunity and a chance to reach 1.0827. The ultimate target will be the area of 1.0862, where I will take profits. In the scenario of a decline in EUR/USD and the absence of activity at 1.0762 in the second half of the day, which is likely, we can confidently talk about the continuation of the downward trend. In this case, I plan to enter the market only after a false breakout formation around 1.0726, the monthly minimum. I will consider opening long positions immediately on the rebound from 1.0698, with the target of an upward correction within the day of 30-35 points.
To open short positions on EUR/USD, the following is required:
Sellers continue to maintain control over the market, counting on the Fed's rigid position. Even if the Fed's stance remains unchanged, we can already anticipate further declines in the pair. However, it would be good to see a false breakout formation around 1.0799 first, which would confirm the correct selling point and provide a signal to update 1.0762 – the middle of the sideways channel, which carries significant importance. Only after breaking and consolidating below this range, as well as a bottom-up retest, do I expect to receive another sell signal targeting 1.0726. The ultimate target will be a minimum of 1.0698, where I will take profits. In the event of an upward movement of EUR/USD during the American session, the absence of bears at 1.0799, and Jerome Powell's soft comments, which are unlikely, buyers will attempt to regain the initiative. This will open the way to 1.0827, where selling is also possible, but only after an unsuccessful consolidation. I will consider opening short positions immediately on the rebound from 1.0862, with the target of a downward correction of 30-35 points.

Indicator Signals:
Moving Averages
Trading is carried out around the 30- and 50-day moving averages, indicating market uncertainty.
Note: The author considers the period and prices of moving averages on the hourly chart (H1), which differs from the general definition of classic daily moving averages on the daily chart (D1).
Bollinger Bands
In the event of a decrease, the lower boundary of the indicator at 1.0779 will act as support.
Indicator Descriptions:
- The moving average (50-day) is marked on the chart in yellow.
- The moving average (30-day) is marked on the chart in green.
- MACD indicator (12-day fast EMA, 26-day slow EMA, and 9-day SMA) indicates the current trend.
- Bollinger Bands (20-day) help identify support and resistance levels.
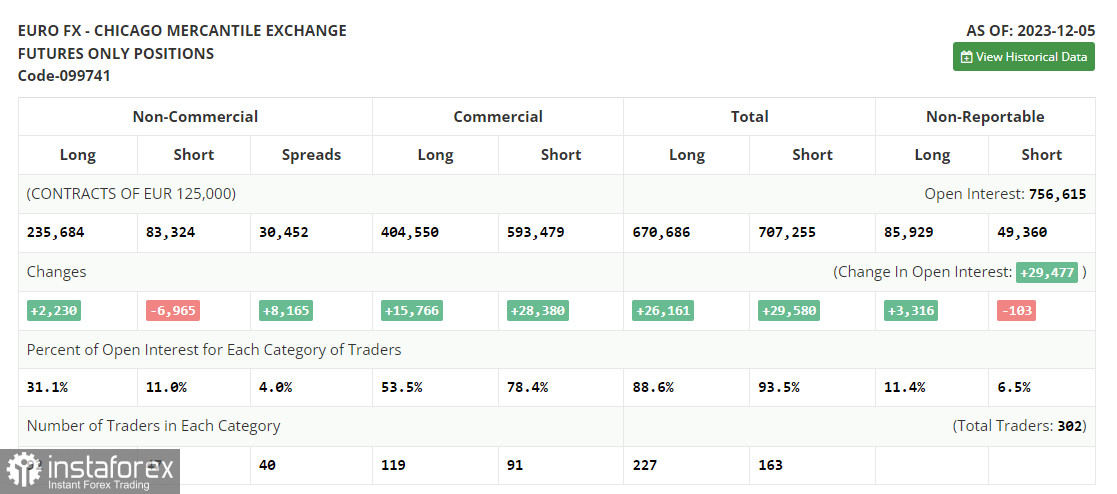
- Non-commercial traders refer to speculators such as individual traders, hedge funds, and large institutions using the futures market for speculative purposes.
- Long non-commercial positions represent the total long open positions of non-commercial traders.
- Short non-commercial positions represent the total short open positions of non-commercial traders.
- The total non-commercial net position is the difference between the short and long positions of non-commercial traders.
 English
 Русский
 Bahasa Indonesia
 Bahasa Malay
 ไทย
ไทย Español
 Deutsch
 Български
 Français
 Tiếng Việt
 中文
中文 বাংলা
বাংলা हिन्दी
 Čeština
 Українська
 Română

