Analysis of EUR/USD 5M

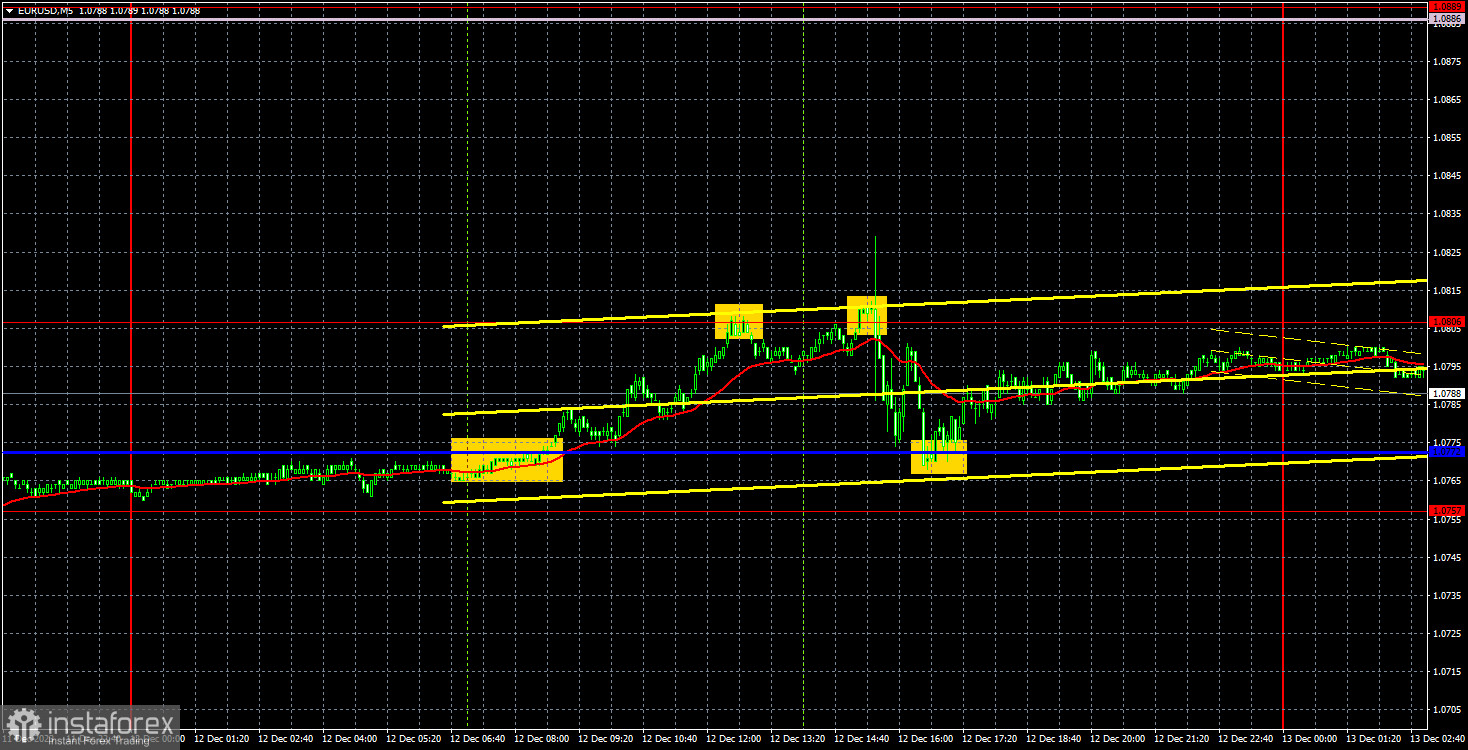
On Tuesday, EUR/USD traded higher but failed to surpass the new level of 1.0818 for the second time. This is a local high established several days ago. The euro has been trading within a sideways channel with boundaries around 1.0740 and 1.0818 for several days now. Of course, a few days of sideways movement cannot be considered a flat. Perhaps traders just took a small break before the central bank meetings, as there are three of them this week. Nevertheless, any extended flat starts with a small one. Furthermore, the Kijun-sen line has already lost its strength.
Yesterday's movements were quite chaotic. Bulls dominated in the first half of the day but couldn't achieve much. In the morning, the gains in the EURUSD were supported by better-than-expected ZEW sentiment data for Germany and the EU. However, the market was focused on the US inflation data from the beginning. It turned out that the Consumer Price Index for November had decreased to 3.1%, as forecasted. Since there were no deviations from the forecasted value, the market, for the most part, had nothing to react to. However, the pair edged down, which did not affect the overall technical picture. Also, this report did not lead to any significant conclusions.
Despite the flat, several good trading signals were generated yesterday, but we have to warn you that the number of false signals may sharply increase in the near future. First, the price crossed the Kijun-sen line and reached the level of 1.0806, which is no longer relevant. It bounced off it twice and returned to the critical line, from which it also bounced off. Traders could open a long position, a short position, and another long position. All three were profitable, but most of the movement occurred in a 40-pip range, making it difficult to expect high profits.
COT report:

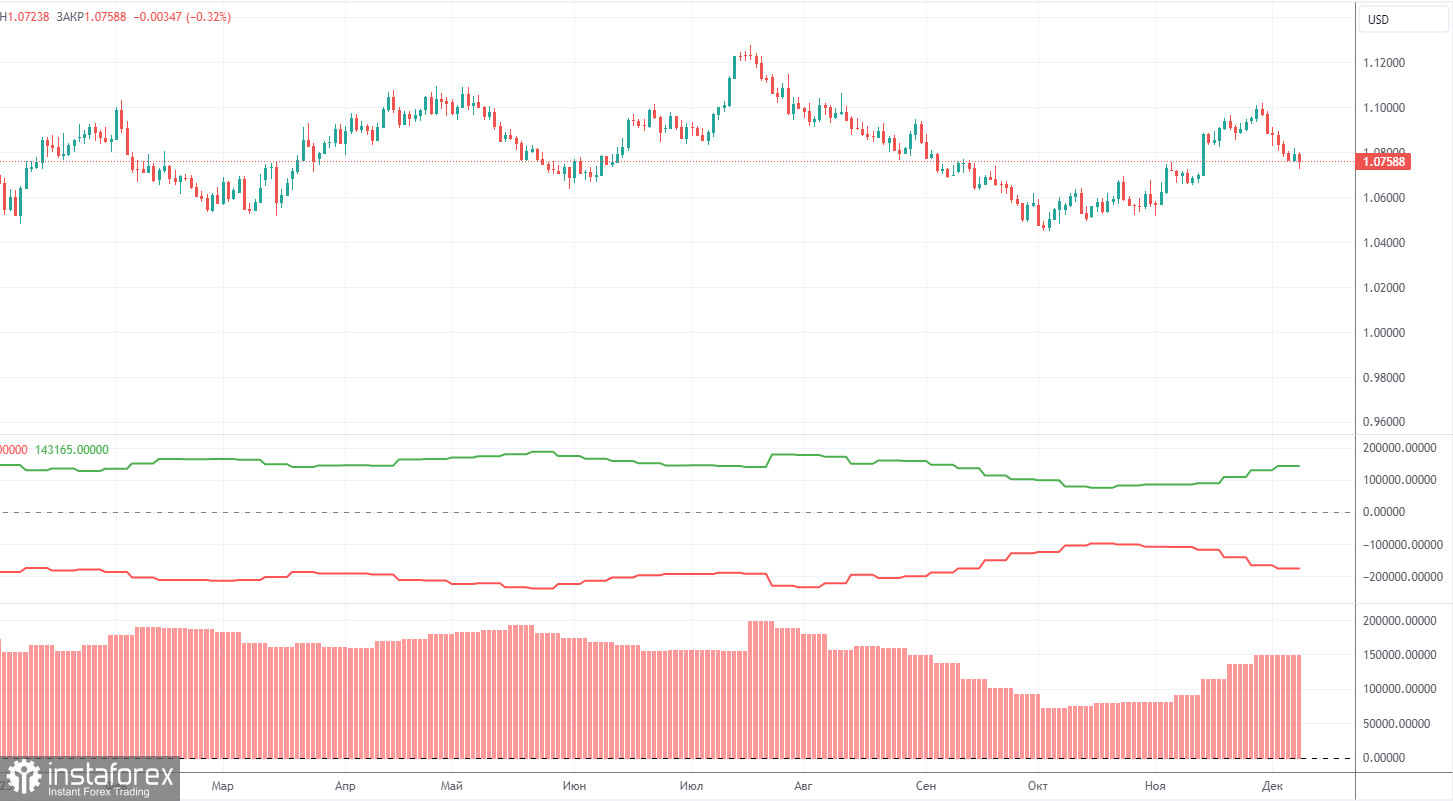
The latest COT report is dated December 5. Over the past 12 months, the COT report data has been consistent with what's happening in the market. The net position of large traders (the second indicator) began to rise back in September 2022, roughly at the same time that the euro started to rise. In the first half of 2023, the net position hardly increased, but the euro remained relatively high during this period. In the last three months, we have seen a decline in the euro and a drop in the net position, as we anticipated. However, in the last few weeks, both the euro and the net position have been rising. Therefore, we can draw a clear conclusion: the pair is correcting higher, but the correction cycle may have finally come to an end.
We have previously noted that the red and green lines have moved significantly apart from each other, which often precedes the end of a trend. Currently, after a small correction, these lines are diverging again. Therefore, we stick to the scenario that the upward trend should come to an end. During the last reporting week, the number of long positions for the "non-commercial" group increased by 2,200, while the number of short positions fell by 6,900. Consequently, the net position increased by 9,100. The number of BUY contracts is still higher than the number of SELL contracts among non-commercial traders by 152,000. In principle, it is now evident even without COT reports that the euro should continue to fall.
Analysis of EUR/USD 1H

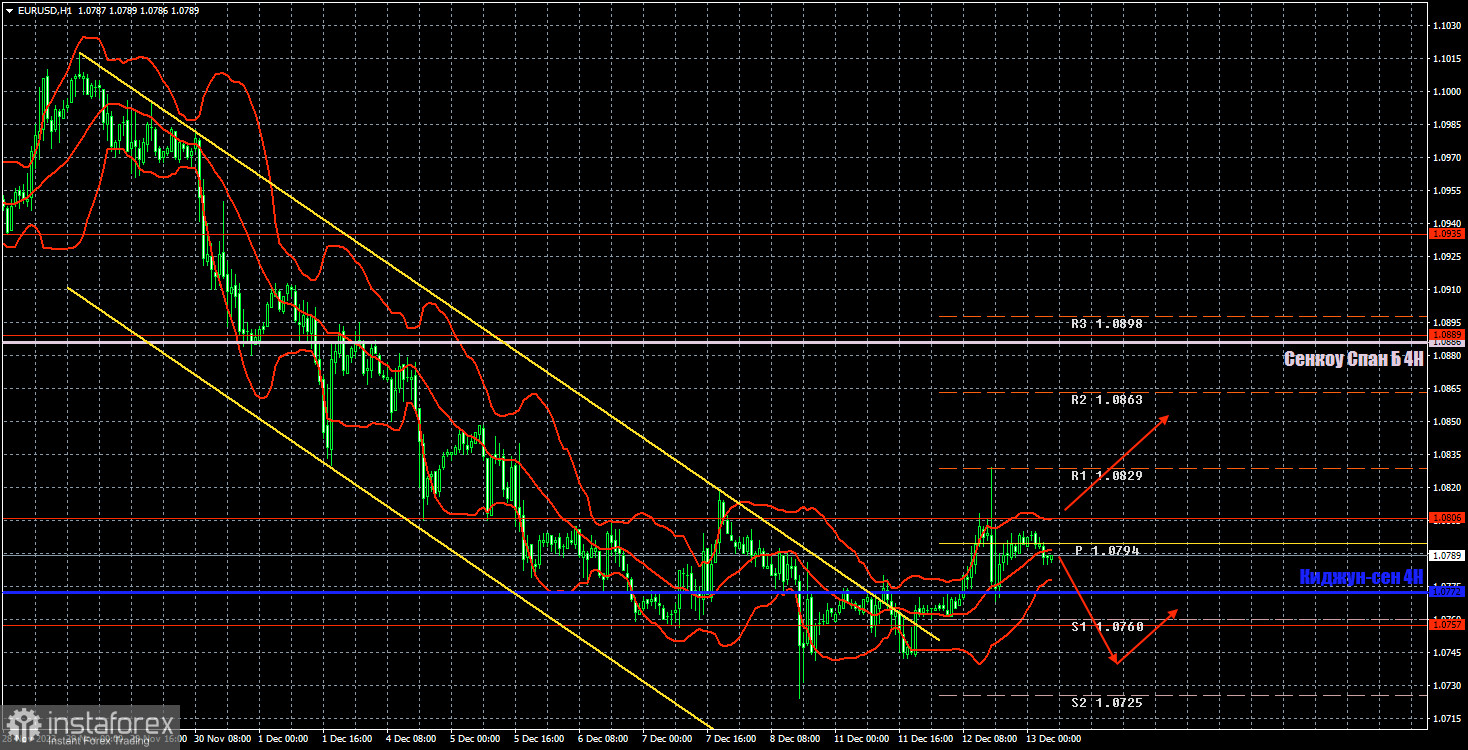
On the 1-hour chart, the pair is trying to start an upward correction but has failed to overcome the level of 1.0818 so it can move towards the Senkou Span B line. If the pair does not overcome this level, it may fall to last week's lows. We believe that the euro should fall, but may correct higher this week.
At this time, traders can consider the following. A rebound from the level of 1.0818 should be used for selling with 1.0745 as the target. The Kijun-sen line can be ignored for now. Consolidation above the level of 1.0818 suggests buying with 1.0886 as the target.
On December 13, we highlight the following levels for trading: 1.0530, 1.0581, 1.0658-1.0669, 1.0757, 1,0818, 1.0889, 1.0935, 1.1043, 1.1092, 1.1137, as well as the Senkou Span B (1.0886) and Kijun-sen (1.0772) lines. The Ichimoku indicator lines can shift during the day, so this should be taken into account when identifying trading signals. There are also auxiliary support and resistance levels, but signals are not formed near them. Signals can be "bounces" and "breakouts" of extreme levels and lines. Don't forget to set a breakeven Stop Loss if the price has moved in the right direction by 15 pips. This will protect against potential losses if the signal turns out to be false.
On Wednesday, eurozone industrial production and the US Producer Price Index may garner investor interest. Both reports are not crucial. However, the FOMC's policy decision is due in the evening, and Federal Reserve Chair Jerome Powell's speech follows later. A new forecast for the key interest rate for the next three years will also be presented.
Description of the chart:
Support and resistance levels are thick red lines near which the trend may end. They do not provide trading signals;
The Kijun-sen and Senkou Span B lines are the lines of the Ichimoku indicator, plotted to the 1H timeframe from the 4H one. They provide trading signals;
Extreme levels are thin red lines from which the price bounced earlier. They provide trading signals;
Yellow lines are trend lines, trend channels, and any other technical patterns;
Indicator 1 on the COT charts is the net position size for each category of traders;
Indicator 2 on the COT charts is the net position size for the Non-commercial group.
 English
 Русский
 Bahasa Indonesia
 Bahasa Malay
 ไทย
ไทย Español
 Deutsch
 Български
 Français
 Tiếng Việt
 中文
中文 বাংলা
বাংলা हिन्दी
 Čeština
 Українська
 Română

